 |
In a press release dated March 4th released after market close, Costco Wholesale Corporation (COST) announced results for the 2nd Quarter ending February 14th.
The following table summarizes the results for the period compared with the values for the corresponding quarter of the previous fiscal year (Values expressed as US$ x 1,000 except EPS)
|
 |
|
|
2nd Quarter Ending
|
Feb. 14th 2021
|
Feb. 16th 2020
|
Difference (%)
|
|
Sales:
|
$44,769,000
|
$39,072,000
|
+14.6
|
|
Gross profit:
|
$5,691,000
|
$5,016,000
|
+13.5
|
|
Operating income1:
|
$1,340,000
|
$1,266,000
|
+5.9
|
|
Pre-tax Income
Net Income
|
$1,319,000
$951,000
|
$1,277,000
$931,000
|
+3.3
+2.2
|
|
Diluted earnings per share:
|
$2.14
|
$2.10
|
+1.9
|
|
Gross Margin (%)
|
12.7
|
12.8
|
-0.8
|
|
Operating Margin (%)
|
3.0
|
3.2
|
-6.3
|
|
Profit Margin (%)
|
2.1
|
2.4
|
-12.5
|
|
Long-term Debt and lease obligations :
|
$12,225,000
|
$12,007,000
|
+1.8
|
|
12 Months Trailing:
|
|
|
|
|
Return on Assets (%)
|
7.2
|
|
|
|
Return on Equity (%)
|
27.8
|
|
|
|
Operating Margin (%)
|
3.7
|
|
|
|
Profit Margin (%)
|
2.5
|
|
|
|
Total Assets (Feb 14 ‘21/Aug. 30 ’20)
|
$54,918,000
|
$55,516,000
|
-1.1
|
|
Market Capitalization
|
$140,500,000
|
|
|
Note 1. Compared to Q2 FY 2020, SGA inflated by 16 percent to $4.34 Billion attributed to COVID-related expenses in Q2 FY 2021, including bonuses and increased worker remuneration.
52-Week Range in Share Price: $276.34 to $393,15 50-day moving average, $351.05
Market Close Feb. 4th $319. Close Feb. 5th post-release $318
Forward P/E 33.3 Beta 0.6
 Percentage same-store sales growth* Q2 FY 2020 to Q2 FY 2021:- Percentage same-store sales growth* Q2 FY 2020 to Q2 FY 2021:-
US. +11.4; Canada +13.4; Other International, 21.5. Composite, COST 13.0. E-commerce +76.
* excluding fuel and Forex.
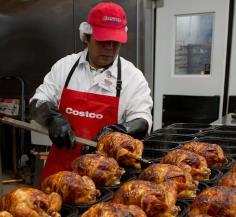
COST operates 804 warehouse locations including 558 in the U.S. and owns and operates Lincoln Premium Poultry producing 2 million rotisserie birds per week for store sales.
|