Weekly Turkey Production and Prices July 30th 2021
Poult Production and Placement:
The July 14th 2021 edition of the USDA Turkey Hatchery Report, issued monthly, documented 26.0 million eggs in incubators on July 1st 2021 (26.0 million eggs on June 1st 2021) and down 6.2 percent (1.7 million eggs) from July 1st 2020.
A total of 21.8 million poults were hatched during June 2021 (20.9 million in May 2021), representing a decrease of 9.1 percent (2.2 million poults) from June 2020.
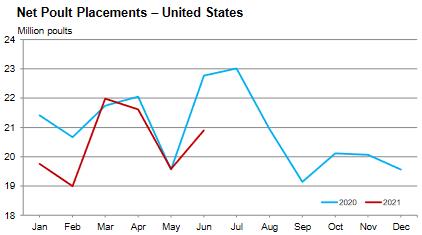
A total of 20.9 million poults were placed on farms in the U.S. in June 2021, (19.5 million in May 2021), and almost the same as in June 2020. This suggests disposal of 0.9 million poults during the month (1.2 million in May 2021). Assuming the proportion of placements corresponded to the respective numbers of toms and hens reared year to date (55:45) 3.7 percent of June-hatched tom poults (0.4 million) and 4.6 percent of hen poults (0.5 million) were not reared. This is an unsubstantiated estimate with a fluctuating demand for processed toms and hens in a post-COVID affected market. (See relative numbers of hen and tom poults processed under Production Data below).
For the twelve-month period July 2020 through June 2021 inclusive, 267.5 million poults were hatched and 246.7 million were placed. This suggests disposal of 20.8 million poults. Assuming the proportion of placements corresponded to the number of toms and hens reared year to date (55:45), 6.8 percent of tom poults (9.4 million) and 8.2 percent of hen poults (11.4 million) were not reared.
To be updated in mid-August 2021 following release of monthly USDA data
Turkey Production:
The July 30th 2021 edition of the USDA Turkey Market News Report (Vol. 68: No.30) confirmed the following provisional data for turkeys slaughtered under Federal inspection:-
- For the processing week ending July 24th 2021, 1.795 million young hens were slaughtered during the processing week at a live weight of 17.2 lbs. (last week 1.865 million hens at 17.3 lbs.). During the corresponding week in 2020, 1.948 million hens were processed, 8.5 percent less than the current week. Ready-to-cook (RTC) hen weight for the week attained 24.8 million lbs. (11,264 metric tons), 10.9 percent less than the corresponding processing week of 2020. Dressing percentage was a nominal 80.5. In 2021 RTC hen production has attained 659.6 million lbs. (299,799 metric tons), 1.1 percent less than for YTD 2020.
- For the processing week ending July 24th 2021, 2.087 million toms were slaughtered at 43.5 lbs, compared to 2.173 million toms processed during the previous week at 43.3 lbs. For the corresponding week in 2020, 2.431 million toms were processed, 16.7 percent more than in the past week. Ready-to-cook tom weight for the week attained 72.9 million lbs. (33,116 metric tons), 14.1 percent less than the corresponding processing week in 2020. Dressing percentage was a nominal 80.5 percent. In 2021 RTC tom product has attained 2,415 million lbs. (1,097,890 metric tons), 8.9 percent less than for YTD 2020.
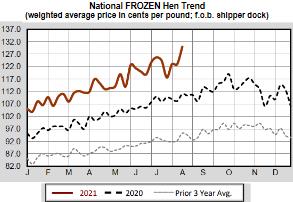
- The National average frozen hen price during the past week was 130.0 cents per lb., up 7.0 cents from the previous week and up approximately 36 cents per lb. from the three-year average. The following prices rounded to nearest cent were documented for domestic and export trading on July 30th 2021:-
|
Product
|
cents per lb.
|
Change from previous Week (%)
|
|
Frozen hens
|
130
|
+5.7
|
|
Frozen toms
|
127
|
+1.6
|
|
Fresh hens
|
141
|
Unchanged
|
|
Fresh toms
|
141
|
Unchanged
|
|
Breasts 4.0-6.5 lb. (frozen)
|
159
|
+12.0
|
|
Breasts (B/S) tom
|
253
|
No new quotation
|
|
Drums (toms for export)
|
113
|
No new quotation
|
|
Wings (V-cut tom)
|
96
|
Unchanged
|
|
Wings (V-cut hens)
|
240
|
No new quotation
|
|
Thigh Meat (frozen for export)
|
204
|
+20.0
|
|
Mechanically Separated (export)
|
69
|
-5.5
|
 Inventories:
On July 26th 2021 cold storage holdings at selected centers amounted to 68,894 lbs., 0.3 percent less than the inventory of 69,101 lbs. on July 1st 2021.
The July 22nd 2021 edition of the USDA Cold Storage Report issued monthly, documented a total turkey stock of 406.0 million lbs. (184,549 metric tons) on June 30th 2021, equivalent to 4.5 weeks of current production and down 14.4 percent compared to the inventory on June 30th 2020. The June 30th value was 3.9 percent above the May 31st 2021 level. This increase is consistent with season and denotes an imbalance between supply and the combination of domestic demand and exports.
The Whole Turkey category of 228.4 million lbs. representing 56.2 percent of total storage of 406.0 million lbs. on June 30th 2021 was 10.6 percent lower than the inventory on June 30th 2020. Tom carcasses in storage increased by 0.5 percent from June 30th 2020 to 144.1 million lbs. on June 30th 2021. Hen carcasses in storage decreased by 24.8 percent from June 30th 2020 to 84.3 million lbs. on June 30th 2021.
Breasts in storage declined by 29.1 percent from June 30th 2020 to 59.5 million lbs. on June 30th 2021.
The “Other” and “Unclassified” categories collectively amounted to 105.0 million lbs. or 25.9 percent of inventory on June 30th 2021. The magnitude of these two non-specified categories suggests that the USDA should attempt to classify product more accurately as to specific product.
June 2021 Production
According to the USDA Poultry Slaughter Report released on July 23rd 2021 covering, June 2021 comprising 22 working days, 18.9 million young turkeys were processed. (0.4 percent less than in June 2020); live weight attained 605.1 million lbs. (2.9 percent less than June 2020); Average live weight was 32.0 lbs. (2.5 percent less than June 2020); RTC attained 483.8 million lbs. (down 2.8 percent from June 2020) with a yield of 79.9 percent. The proportion of frozen product in June 2021 attained 39.5 percent of total RTC produced. In May 2021 ante-mortem condemnation attained 0.32 percent of live weight, (0.27 in June 2020). During June 2021, 1.3 percent of RTC weight was condemned (1.3 percent in June 2020)
Comments:
Please review comments in the Weekly Broiler Report and the year-to-date export data under the Statistics Tab.
The USMCA has been in effect since July 1st 2020. The U.S. turkey industry shipped 173,544 metric tons to Mexico or 62.6 percent of all turkey exports, valued at $389 million during 2018. In 2019 Mexico received 176,789 metric tons representing 60.9 percent of turkey exports valued at $427 million. Thailand commenced importing raw turkey effective January 1st 2021 after lifting an avian influenza embargo that was placed on the U.S. allowing only cooked turkey in 2015. During 2020 Mexico imported 166,771 metric tons of turkey products valued at $379 million with a unit value of $2,273. During 2020 China imported 17,260 metric tons of turkey products with a value of $28.7 million representing a unit value of $1,663 per metric ton.
For the first five months of 2021 exports of turkey products attained 102,547 metric tons valued at $237 million down 0.4 percent in volume and 2.5 percent in value compared to 2020. Unit value declined by 2.1 percent from January-May 2020 to $2,311 per metric ton over the corresponding five months in 2021.