 On February 15th 2010 Seaboard Corporation (SEB) released results for Q4 and FY 2019 ending December 31st 2021. The company is a conglomerate with segments dedicated to pork production, grain milling, commodity trading, marine transport and power generation. Seaboard owns half the equity of Butterball LLC.
For FY 2019 SEB earned $570 million on sales of $9,229 million with an EPS of $490.36. Comparable values for FY 2020 were net earnings of $283 million with sales of $7,126 with an EPS of $244.21. On December 31st 2021 Seaboard posted assets of $7,503 million and long-term debt and lease obligations of $1,068 million compared to an intraday market capitalization of $4,410 million on February 20th with 78 percent of equity held internally. The 12-month trailing operating margin was 4.9 percent with a profit margin of 6.1 percent. Return on assets was 4.0 percent and 13.8 percent on equity. During the past 52 weeks share price has ranged from $3,110 to $4,400 with a 50-day moving average of $3,848.
 Seaboard owns half of Butterball LLC. and the performance of this non-incorporated subsidiary, producing approximately 0.5 million tons of product annually, is reflected in the Seaboard Corp. SEC 10-K report. For FY 2021 Butterball lost $38 million compared to a loss of $20 million in FY 2020. Butterball sales attained $1,792 in FY 2021. The subsidiary posted assets of $991 million against liabilities of $517 million.
The SEC 10-K report includes the following statements:-
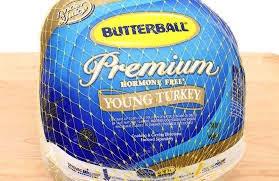
Turkey Segment - Seaboard has a 50% non-controlling interest in Butterball, LLC (“Butterball”), a vertically integrated producer and processor of conventional, antibiotic-free and organic turkey products. Butterball is a national supplier to retail stores, foodservice outlets and industrial entities, and to a lesser extent, exports products to Mexico and other foreign markets. The Turkey segment had two retail customers that collectively represented approximately 28% of its sales in each of the last three years.
Seaboard’s Turkey segment has a total of three processing plants, three further processing plants and numerous company and third-party live production facilities and feed milling operations, located in North Carolina, Arkansas, Missouri and Kansas. These facilities produce approximately one billion pounds of turkey each year. Although capacity to meet core further processing demand is sufficient, Butterball uses third-party co-packer arrangements to supplement portions of its portfolio where it either does not maintain competencies, or to meet demand beyond its internal production capacity.
The Turkey segment, accounted for using the equity method, represents Seaboard’s investment in Butterball. The increase in loss from affiliate for 2021 compared to 2020 was primarily the result of lower sales volumes and higher live and plant production costs due to increased feed and labor prices, partially offset by higher sales due to increased prices. The decrease in loss from affiliate for 2020 compared to 2019 was primarily the result of higher sales attributable to more whole bird volumes and increased prices related to a stronger sales mix of value-added products sold and less interest expense, partially offset by higher live and production costs. Management is unable to predict market prices for turkey products, the cost of feed or the ongoing impacts of the COVID-19 pandemic, including variants, for future periods. Based on these conditions, management cannot predict if this segment will be profitable in 2022. The uncertainties and the volatility of the commodity grain markets could have a significant impact on this segment’s profitability.