
|

Poultry Industry Statistics and Reports
|
Meat Projection March 2024
|
03/15/2024 |
|
Updated USDA-ERS Poultry Meat Projection for March 2024.
 On March 15th 2024 the USDA-Economic Research Service released updated production and consumption data with respect to broilers and turkeys, covering 2022 (actual), an updated projection for 2023 and a forecast for 2024. On March 15th 2024 the USDA-Economic Research Service released updated production and consumption data with respect to broilers and turkeys, covering 2022 (actual), an updated projection for 2023 and a forecast for 2024.
The 2023 projection for broiler production is 46,387 million lbs. (21.085 million metric tons) up 0.4 percent from 2022 and less than a 0.1 percent upward adjustment from the February 2024 report. USDA projected per capita consumption of 99.5 lbs. (45.2 kg.) for 2023, down 0.1 percent from 2022. Exports will attain 7,265 million lbs. (3.302 million metric tons), 0.1 percent below the previous year.
The 2024 USDA forecast for broiler production will be 46,875 million lbs. (21.306 million metric tons) up 1.1 percent from 2023 with per capita consumption up 0.3 lb. to 100.4 lbs. (45.6 kg). Exports will be 1.4 percent lower than in 2023 to 7,165 million lbs. (3.257 million metric tons), equivalent to 15.4 percent of production.
Production values for the broiler and turkey segments of the U.S. poultry meat industry are tabulated below:-
|
Parameter
|
2022
(actual)
|
2023
(projection)
|
2024
(forecast)
|
Difference
2023 to 2024
|
|
Broilers
|
|
|
|
|
|
Production (million lbs.)
|
46,207
|
46,387
|
46,875
|
+0.8
|
|
Consumption (lbs. per capita)
|
98.9
|
99.5
|
100.4
|
+0.9
|
|
Exports (million lbs.)
|
7,290
|
7,265
|
7,165
|
-1.4
|
|
Proportion of production (%)
|
15.8
|
15.7
|
15.3
|
-2.5
|
|
|
|
|
|
|
|
Turkeys
|
|
|
|
|
|
Production (million lbs.)
|
5,222
|
5,457
|
5,370
|
-1.6
|
|
Consumption (lbs. per capita)
|
14.6
|
14.8
|
14.7
|
-0.7
|
|
Exports (million lbs.)
|
407
|
489
|
520
|
+6.3
|
|
Proportion of production (%)
|
7.8
|
9.0
|
9.7
|
7.8
|
Source: Livestock, Dairy and Poultry Outlook released March 15th 2024
The March USDA report updated projection for the turkey industry in 2023 including annual production of 5,457 million lbs. (2.480 million metric tons), up 4.5 percent from 2022. Consumption in 2023 was projected at 14.8 lbs. (6.7 kg.) per capita, up 1.4 percent from the previous year. Export volume will increase by 20.1 percent in 2023 to 489 million lbs. (222,272 metric tons). Values for production and consumption of RTC turkey in 2023 are considered to be realistic, given year to date data, the prevailing economy, variable weekly poult placements, production levels, freedom from HPAI and inventories.
 The 2024 forecast for turkey production will be 5,370 million lbs. (2.441 million metric tons) down 1.6 percent from 2023 with per capita consumption down 0.7 percent to 14.7 lbs. (6.7 kg). Exports will be 6.3 percent higher than in 2023 to 520 million lbs. (236,000 metric tons) equivalent to 9.7 percent of production. The 2024 forecast for turkey production will be 5,370 million lbs. (2.441 million metric tons) down 1.6 percent from 2023 with per capita consumption down 0.7 percent to 14.7 lbs. (6.7 kg). Exports will be 6.3 percent higher than in 2023 to 520 million lbs. (236,000 metric tons) equivalent to 9.7 percent of production.
Export projections do not allow for a breakdown in trade relations with existing major partners including Mexico, Canada and China nor the impact of catastrophic diseases including HPAI and vvND in either the U.S. or importing nations
The USDA export projection takes into account declining broiler product exports to China. For 2022, China imported 622,099 tons of broiler products valued at $1,087 million including feet at an average unit price of $1,263 per ton. Feet represented 77.8 percent of volume during 2022 (483,538 metric tons) at a unit price of $1,926 per ton. Compared to 2022, exports to China during 2023 were 34 percent lower in volume to 405,343 metric tons and 34 percent lower in value to $711 million.
Subscribers are referred to the monthly export report in this edition and update of production data and cold storage inventories of broilers and turkeys respectively posted in each end-of- month edition of CHICK-NEWS with the previous monthly data under the STATISTICS tab.

|
U.S. Broiler and Turkey Exports, January 2024
|
03/15/2024 |
|
OVERVIEW
 Total exports of bone-in broiler parts and feet during January 2024 attained 301,200 metric tons, 4.0 percent lower than in January 2023 (316,629 metric tons). Total value of broiler exports increased by 3.3 percent to $386.8 million ($374,6 million). Total exports of bone-in broiler parts and feet during January 2024 attained 301,200 metric tons, 4.0 percent lower than in January 2023 (316,629 metric tons). Total value of broiler exports increased by 3.3 percent to $386.8 million ($374,6 million).
Total export volume of turkey products during January 2024 attained 16,684 metric tons, 37.9 percent more than in January 2024 (12,098 metric tons). Total value of turkey exports increased by 3.3 percent to $44.8 million ($42.0 million).
Unit price for the broiler industry is constrained by the fact that leg quarters comprise over 97 percent of broiler meat exports by volume (excluding feet). From the first quarter of 2021 through 2022, unit value of leg quarters increased consistent with international demand followed by a decline in 2023. Leg quarters represent a relatively low-value undifferentiated commodity lacking in pricing power. Exporters of commodities are subjected to competition from domestic production in importing nations. Generic products such as leg quarters are vulnerable to trade disputes and embargos based on real or contrived disease restrictions.
HPAI has emerged as a panornitic affecting the poultry meat industries of four continents with seasonal outbreaks. The distribution in the U.S. limits eligibility for export depending on restrictions imposed by importing nations
 Ongoing outbreaks of African swine fever in China and Southeast Asia from early 2019 and Europe from 2010 onwards reduced the availability of pork. In addition, disruptions in chicken production and logistics due to COVID restrictions decreased availability of protein with international repercussions on trade in chicken and pork. The demand for pork imports to China has diminished with restoration of domestic hog production. Mild overproduction is evident in the white-feathered broiler sector with implications for exports other than feet extending into 2024. Ongoing outbreaks of African swine fever in China and Southeast Asia from early 2019 and Europe from 2010 onwards reduced the availability of pork. In addition, disruptions in chicken production and logistics due to COVID restrictions decreased availability of protein with international repercussions on trade in chicken and pork. The demand for pork imports to China has diminished with restoration of domestic hog production. Mild overproduction is evident in the white-feathered broiler sector with implications for exports other than feet extending into 2024.
EXPORT VOLUMES AND PRICES FOR BROILER MEAT
During January 2024 the National Chicken Council (NCC), citing USDA-FAS data, documented exports of 303,591 metric tons of chicken parts and other forms (whole and prepared), down 3.8 percent from January 2023. Exports were valued at $395.0 million with a weighted average unit value of $1,301 per metric ton.
The NCC breakdown of chicken exports for January 2024 by proportion and unit price for each category compared with the corresponding month in 2023 (with the unit price in parentheses) comprised:-
- Chicken parts (excluding feet) 97.4%; Unit value $1,231 per metric ton ($1,148)
- Prepared chicken 2.0%; Unit value $4,502 per metric ton ($4,183)
- Whole chicken 0.6%; Unit value $1,880 per metric ton ($1,621)
- Composite Total 100.0%; Av. value $1,301 per metric ton ($1,208)

|
Monthly Turkey Production and Prices, February 26th 2024
|
02/26/2024 |
|
Poult Production and Placement:
The February 14th 2024 edition of the USDA Turkey Hatchery Report, issued monthly, documented 24.98 million eggs in incubators on February 1st 2024 compared to 27.61 million eggs on February 1st 2023* The February 2024 set was down 9.5 percent (2.63 million eggs) from February 2023 and 34,000 eggs (0.1 percent) less than the previous month of January 2024.
A total of 21.63 million poults were hatched during January 2024 down 1.77 million poults (7.5 percent) compared to 23.40 million in January 2023*. The January 2024 hatch was down 38,000 poults (0.2 percent) from the previous month of December 2023.
A total of 19.93 million poults were placed on farms in the U.S. in January 2024, compared to 21.58 million in December 2023*. The January 2024 placement was 7.7 percent, (1.63 million poults) less than in January 2023. This data confirms disposal of 1.70 million poults during the month. Approximately 7.9 percent of the January 2024 hatch was not placed.
For the twelve-month period February 2023 through January 2024 inclusive, 269.27 million poults were hatched and 251.37 million were placed. This confirms disposal of 17.89 million poults over the 12-month period, corresponding to 6.6 percent of all poults hatched.
* USDA revision from previous monthly report.
Turkey Production:
The February 23rd 2024 edition of the Turkey Market News Reports documented the following provisional data for turkeys slaughtered under Federal inspection:-
- For the processing week ending February 17th 2024, 1.609 million hens were processed at 16.5 lbs. live. This was 2.5 percent more than the 1.560 million hens processed during the corresponding week in January 2024 and 8.7 percent less than the 1.762 million processed during the corresponding week in January 2023. Hen slaughter year-to-date has attained 10.9 million, 6.4 percent less than for the corresponding period in 2023.
Ready to cook (RTC) weight for hens over the most recent week was 21.44 million lbs. (9,744 metric tons). This quantity was 4.6 percent more than the 20.50 million lbs. for corresponding week in January 2024 and 16.1 percent less than the 25.6 million lbs. during the corresponding week in February 2023. Dressing percentage was a nominal 80.5 percent. For 2024 to date RTC hen production attained 146.2 million lbs. (66,460 metric tons). This quantity is 13.4 percent less than for the corresponding period in 2023.
- For the processing week ending February 17th 2024, 1.995 million toms were processed at 44.8 lbs. live. This was 5.7 percent more than the 1.887 million toms processed during the corresponding week in January 2024 and 7.9 percent more than the 1.849 million during the corresponding week in February 2023. Year-to-date 13.48 million toms have been processed, 1.3 percent less than for the corresponding period in 2023.
Ready to cook (RTC) weight for toms during the most recent week was 72.0 million lbs. (32,718 metric tons). This quantity was 2.7 percent more than the 70.1 million lbs. processed during the corresponding week in January 2024 and 9.1 percent more than the 66.0 million lbs. during the corresponding week in February 2023. Dressing percentage was a nominal 80.5 percent. For 2024 to date RTC tom production attained 489.6 million lbs. (225,587 metric tons). This quantity is 1.1 percent less than the corresponding period in 2022.
|
Monthly Broiler Production and Prices, February 26th 2024.
|
02/26/2024 |
|
Broiler Chick Placements.
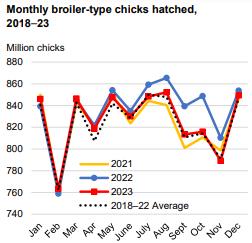
According to the February 21st 2024 USDA Broiler Hatchery Reports, 966.66 million eggs were set over five weeks extending from the week ending January 20th 2024 through February 17th 2024 inclusive. This quantity was higher by one percent compared to the corresponding period in 2023.
Total chick placements for the U.S. over the five-week period amounted to 927.85 million chicks. Claimed hatchability for the period averaged 79.5 percent for eggs set three weeks earlier, down from 79.8 percent for the preceding four-week period. Each 1.0 percent change in hatchability represents approximately 1.85 million chicks placed per week and 1.76 million broilers processed, assuming five percent culls and mortality with the current range of weekly settings.
Cumulative chick placements for the period January 7th through December 30th 2023 amounted to 9.67 billion chicks. For January 6th through February 17th 2024 chick placements attained 1.3 billion
According to the February 26th 2024 edition of USDA Chickens and Eggs pullet breeder chicks hatched and intended for U.S. placement during January 2024 amounted to 7.28 million, down 9.1 percent (226,000 pullet chicks) from January 2023 and 2.37 million pullet chicks or 24.5 percent less than the previous month of December 2023. Broiler breeder hen complement attained 61.2 million on February 1st 2024, 0.4 percent higher (300,000 hens) than on February 1st 2023.
Broiler Production
As documented in the February 23rd 2024 USDA Broiler Market News Reports for the processing week ending February 17th 2024, 164.2 million broilers were processed at 6.46 lbs. live. This was 4.8 percent less than the 172.8 million broilers processed during the corresponding week in the previous month of January 2024 and 1.9 percent less than the 167.4 million processed during the corresponding week in February 2023. Broilers processed in 2024 to date amounted to 1,123 million, 3.6 percent lower than for the corresponding period in 2023.
Ready to cook (RTC) weight for the most recent week was 806.1 million lbs. (366,399 metric tons). This was 6.5 percent less than the 861.8 million lbs. processed during the corresponding week in January 2024 and 3.1 percent less than the 809.0 million lbs. during the corresponding week in February 2023. Dressing percentage was a nominal 76.0 percent. For 2024 to date RTC broiler production attained 5,543 million lbs. (2.52 million metric tons). This quantity was 1.8 percent less than the corresponding period in 2023.
Broiler Prices
The USDA National Composite Weighted Wholesale price compared over a four-week period was down 2.4 cents per lb. or 1.9 percent to 126.3 cents per lb. compared to the corresponding week in January 2024. The attached USDA figures denotes average prices over three-years.
Leading QSRs are using increasing quantities of breast meat for sandwiches, strips and nuggets. Inflation is increasing consumer awareness of value with chicken benefitting at the expense of beef and pork
|
Broiler Month
|
12/22/2023 |
|
Monthly Broiler Production and Prices, November 27th 2023.
 Broiler Chick Placements. Broiler Chick Placements.
According to the December 20th 2023 USDA Broiler Hatchery Reports 987.87 million eggs were set over five weeks extending from week ending November 18th through December 16th inclusive. This quantity was down approximately two percent compared to the corresponding period in 2022.
Total chick placements for the U.S. over the five-week period amounted to 921.81 million chicks. Claimed hatchability for the period averaged 80.3 percent for eggs set three weeks earlier (80.3 percent for the preceding four-week period). Each 1.0 percent change in hatchability represents approximately 1.80 million chicks placed per week and 1.70 million broilers processed assuming five percent culls and mortality with the current range of weekly settings.
Cumulative chick placements for the period January 7th 2023 through December 16th amounted to 9.30 billion chicks, one percent lower than the corresponding period in 2022.
According to the December 21st 2023 edition of USDA Chickens and Eggs pullet breeder chicks hatched and intended for U.S. placement during November 2023 amounted to 8.21 million, up 7.1 percent (545,000 pullet chicks) from November 2022 and 196,000 pullet chicks or 2.5 percent more than the previous month of October 2023. Broiler breeder hen complement attained 63.37 million on November1st 2023, 2.0 percent higher (1,257,000 hens) than on November 1st 2022.
Broiler Production
As documented in the December 22nd USDA Broiler Market News Report for the processing week ending December 16th 2023, 167.6 million broilers were processed at 6.47 lbs. live. This was 0.5 percent more than the 166.8 million broilers processed during the corresponding week in the previous month of November 2023 and 1.5 percent less than the 170.2 million processed during the corresponding week in December 2022. Broilers processed in 2023 to date amounted to 8.31 billion, 2.1 percent lower than for the corresponding period in 2022.
Ready to cook (RTC) weight for the most recent week was 824.1 million lbs. (374,595 metric tons). This was 0.2 percent more than the 822.6 million lbs. processed during the corresponding week in November 2023 and 2.4 percent less than the 844.5 million lbs. during the corresponding week in December 2022. Dressing percentage was a nominal 76.0 percent. For 2023 to date RTC broiler production attained 40.37 million lbs. (18.35 million metric tons). This quantity was 2.2 percent less than the corresponding period in 2022.
Broiler Prices
The USDA National Composite Weighted Wholesale price averaged over the past week were up 13.3 cents per lb. or 11.8 percent compared to the corresponding week in November 2023 at 127.0 cents per lb. The attached USDA figures denotes average prices over three-years.
Leading QSRs are using increasing quantities of breast meat for sandwiches, strips and nuggets. Inflation is increasing consumer awareness of value with chicken benefitting at the expense of beef and pork
|
USDA Export Projections For Chicken
|
09/02/2022 |
|
 Based on the August 12th, 2022 World Agricultural Supply and Demand Estimates, USDA has projected chicken exports for 2022 with a forecast for 2023. Based on the August 12th, 2022 World Agricultural Supply and Demand Estimates, USDA has projected chicken exports for 2022 with a forecast for 2023.
Broiler meat exports will amount to 3.3 million metric tons in 2022 valued at $4.2 billion. For 2023, volume and value will be unchanged, representing a unit price excluding feet, which are not federally inspected, at $1,272 per metric ton.
 The 2023 exports of all agricultural products will amount to $193.5 billion in 2023, balanced by imports of $197.0 billion resulting in a negative annual balance of $3.5 billion. The 2023 exports of all agricultural products will amount to $193.5 billion in 2023, balanced by imports of $197.0 billion resulting in a negative annual balance of $3.5 billion.
|
|
|
|

|
| |
Copyright © 2024 Simon M. Shane
|
|
|