
Editorial
|
Balance Between Pre-election Rhetoric and Outcomes
or You Can’t Have It Both Ways!
|
|
 It is evident that the incoming Administration of President Donald J. Trump will attempt to implement many of the pre-election promises early during the coming term of office. The principal policies will revolve around deportation of illegal immigrants and improving the financial wellbeing of citizens. These objectives will establish conflicts that have a direct bearing on agriculture and hence the availability and price of food. Apparent conflicts will have to be resolved by concessions made by both sides of the aisle in the 119th Congress. Legislators holding extreme positions on the left and right will be forced to moderate their entrenched positions in the interests of the nation. It is evident that the incoming Administration of President Donald J. Trump will attempt to implement many of the pre-election promises early during the coming term of office. The principal policies will revolve around deportation of illegal immigrants and improving the financial wellbeing of citizens. These objectives will establish conflicts that have a direct bearing on agriculture and hence the availability and price of food. Apparent conflicts will have to be resolved by concessions made by both sides of the aisle in the 119th Congress. Legislators holding extreme positions on the left and right will be forced to moderate their entrenched positions in the interests of the nation.
Potential conflict areas include:
- Tariffs raise the prospects of trade wars. If the Administration imposes tariffs on our two USMCA partners, in addition to the E.U. and especially China, trade will be impacted by countervailing punitive action. This will reduce exports and disturb the equilibrium between domestic supply and demand. Prices for major agricultural commodities including corn and soybeans will fall to the advantage of livestock producers but will seriously reduce the earnings of row-crop farmers.
- Deportation of nondocumented agricultural workers will reduce the availability of labor and increase the cost of production. This will be passed onto consumers and will run counter to the promise to reduce family expenditure on food.
- Relaxation of environmental, health, financial and other regulations will facilitate expansion of some agricultural operations. Advantages may however be offset by fraud, a decline in food safety standards and environmental degradation.
- Reversal of climate remediation will be counterproductive. Progress has been made in reducing greenhouse gas emissions by adopting solar and wind generation of electrical power displacing fossil fuels. Encouraging greater use of petroleum products through a “drill-baby-drill” approach may be both impractical and ultimately costly. Global warming is contributing to the frequency and intensity of hurricanes and other weather extremes imposing high costs for response and repair of damage. Reversing progress in clean energy through restricting wind, solar and nuclear generation would be to the medium- and long-term detriment of our economy and health in the U.S.

- Reducing government expenditure by as much as $2 trillion annually would require extensive reductions in social security and Medicaid benefits. Although preventive medicine will ultimately reduce the cost of treatment of chronic conditions, benefits would only accrue in future decades, but the pain would be borne in the immediate term.
- Increasing farm support would appear necessary following a trade war characterised by reduced exports, increased costs for labor and the inevitable restoration of inflation predicated by a program of tariffs. This would require an increase in the national debt that is antithetical to conservative values.

Radical solutions to current problems will have unintended consequences. The move towards isolation as exemplified by the Smoot-Hawley Tariff Act of 1930 effectively precipitated the great depression over the third decade of the previous century. Farmers were the most impacted segment of the economy resulting in profound demographic changes in our population. Despite improved efficiency in the agricultural sector through consolidation and mechanization, both cost and revenue will be adversely affected by inappropriate and imprudent policy decisions.
It is hoped that bipartisanship and sound economic policies will prevail in the coming administration and 119th Congress and that extreme pre-electoral rhetoric and promises will be modulated in the interests of wellbeing of our citizenry and long-term growth of the economy.

|
|
Poultry Industry News
|
Stop Press
|
|
 Seasonal Return of Avian Influenza Seasonal Return of Avian Influenza
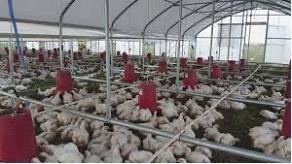
As anticipated, avian influenza has returned to commercial turkeys and has impacted the first egg production complex of the fall season. Effective September 25th, there were twelve outbreaks in the Dakotas and Minnesota involving close to 750,000 growing turkeys and one large egg production complex of 3.1 million hens and 250,000 pullets in Wisconsin. Concurrently, USDA surveys have detected H5 avian influenza virus with a Eurasian genome in twelve states over the past thirty days. Of specific concern is the frequency of isolations from black vultures that now appear to be disseminators of the pathogen in addition to migratory waterfowl.
Although high levels of structural and operational biosecurity are advised, even the most stringent precautions will not provide absolute protection. Had the U.S. commenced preemptive vaccination of replacement pullets during the first quarter of 2025 during the period of winter losses we would have been in a more favorable position as we enter the fourth quarter of the year with the potential for losses.
|
Brought to you by Hamlet Protein
|
|
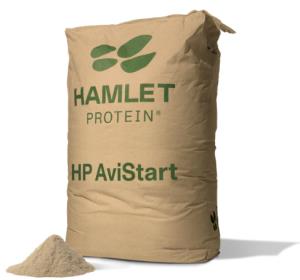
 This special edition is sponsored by Hamlet Protein, manufacturers of HP AviStart a soybean meal product subjected to a patented multi-stage enzymatic treatment at mild temperature. The product incorporated at five percent or higher to chick and poult diets displacing conventional soybean meal over the first ten days post-hatch enhances growth rate and feed conversion efficiency as detailed in the featured article. This special edition is sponsored by Hamlet Protein, manufacturers of HP AviStart a soybean meal product subjected to a patented multi-stage enzymatic treatment at mild temperature. The product incorporated at five percent or higher to chick and poult diets displacing conventional soybean meal over the first ten days post-hatch enhances growth rate and feed conversion efficiency as detailed in the featured article.
This edition presents current industry statistics on broiler production including export data, a projection for 2026, a summary of recent USDA-FAS GAIN reports and a commentary on the non-viability of vegetable-based alt-meat as exemplified by the Q2 results posted by Beyond Meat Inc.
View the Findlay OH plant tour: https://www.youtube.com/watch?v=o68Elk4qWTI
|
 |
|
|
HP AviStart Supercharges Early Broiler Growth
|
|
 Introduction Introduction
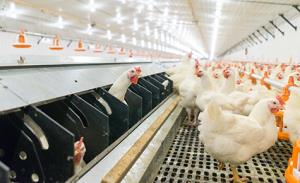
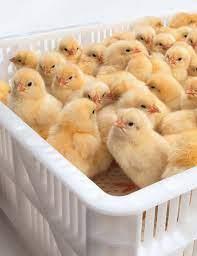
HP AviStart was developed by Hamlet Protein based on subjecting selected high-quality soybean meal to a unique patented enzymatic and heat process. Inclusion of HP AviStart in pre-starter and starter diets, promotes digestion and absorption of amino acids in the immature chick and poult’s intestinal tract, promoting growth that is measurable at harvest. Processing of soybean meal to produce HP AviStart sharply reduces anti-nutritional factors. With benefits to feed conversion efficiency and the integrity of foot pads. The combination of enzymatic treatment at moderate temperatures, facilitates rapid digestion of protein and absorption of amino acids along the proximal small intestine, compared to non-processed soybean meal.
The Science Supporting HP AviStart
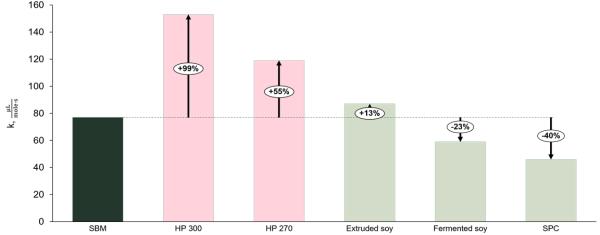 |
One of the mechanisms of action of HP AviStart can be measured by applying protein kinetics, which quantifies the speed of digestion of protein in the different intestinal segments, establishes the site at which amino acids are absorbed, and finally demonstrates their level in the portal circulation - ready for tissue deposition. Protein quality is traditionally evaluated by its digestibility. This parameter quantifies residual undigested protein at the termination of the ileum. The speed of digestion, the rate of amino acid absorption and the site within the small intestine are not considered when determining the digestibility coefficient. A rapid rate of protein digestion is an important factor in attaining feed conversion efficiency, especially during the first ten days of growth when the digestive tract is immature and is increasing in size disproportionately to deposition of muscle tissue. The speed of protein degradation can be measured in vitro from the hydrolysis constant, which is determined indirectly by pH titration under controlled incubation in the presence of proteolytic enzymes over a two-hour period.
The difference in the kinetics of protein digestion and subsequent absorption of constituent amino acids among conventional feed-grade soybean meal and alternative protein sources demonstrates the beneficial effects of enzymatic processing under controlled mild heat. It is evident from the following figure that HP AviStart is absorbed at a faster rate than conventional soybean meal characterizing the product as a “fast protein”.
Enzymatic processing in the presence of heat over a defined period as applied by the Hamlet Protein process inactivates anti-nutritional factors. Although trypsin inhibitor is usually inactivated by solvent extraction with flash evaporation, crushing plants may either under- or over- process soybean meal with deleterious effects on growth rate. Heat processing does not generally degrade or inactivate other anti-nutritional factors including galacto-oligosaccharides including stachyose and raffinose. These compounds contribute to fermentation in the terminal intestinal tract, and provoke inflammation of the mucosa, leading to dysbacteriosis, and predisposing to a range of intestinal conditions including clostridial necrotic enteritis
|
Anti-nutritional factor
|
Mean of n=180
|
|
Trypsin inhibitor mg/g
|
3.5
|
|
Stachyose g/kg
|
63.9
|
|
Raffinose g/kg
|
10.9
|
|
Beta conglycinin ppm
|
15x103 to 150x103
|
ANTI-NUTRITIONAL FACTORS IN U.S. SOYBEAN MEAL
Scientific trial
Inclusion of HP AviStart in a broiler starter diet at five percent over a ten-day period resulted in a four percent increase in live weight, representing a statistically significant (p ? 0.05) increase compared to controls receiving an isonitrogenous diet incorporating conventional soybean meal. The increase in live weight was attributed to deposition of muscle tissue as a result of more efficient digestion due to the availability of amino acids from HP AviStart, classified as a ‘fast protein’. This presumption is supported by increased trypsin activity throughout the intestinal tract and higher jejunal mRNA expression of transporters of peptides and amino acids. These observations are correlated with elevated levels of amino acids in the portal vessels supplying the liver, compared to controls receiving conventional soybean meal.
Financial appraisal of HP AviStart
 To determine the potential benefit of adding HP AviStart to a broiler pre-starter or starter diet, realistic assumptions were included in the following projection: To determine the potential benefit of adding HP AviStart to a broiler pre-starter or starter diet, realistic assumptions were included in the following projection:
- The cost of 48 percent soybean meal is $300 per tonThe cost of HP AviStart is around to $800 per ton
- Conventional starter diet contains 27 percent soybean meal
Then:
The contribution to diet cost of soybean meal at this inclusion level is $81 per ton.
If HP AviStart displaces soybean meal at an inclusion level of five percent of the diet, the combined cost per ton would be:
22 percent soybean meal, amounting to $66
5 percent HP AviStart, amounting to $40
Cost of combination $106 per ton
Differential as a result of the inclusion of HP AviStart is equivalent to an increase of $25 per ton or 1.25 cents per lb.
In the field:
Projected feed consumption over the first ten days will be 0.57 lb. The incremental cost of HP AviStart inclusion will be 0.71 cents per bird
- Assume a live weight of 6.5 lb. at harvest
- With a standard WOG 75 percent yield, 4.9 lb. of RTC will be attained per bird
Each 1 percent improvement in live weight represents 0.05 lb./bird
- Assume RTC value after primary processing at $1.00 per lb.
1 percent improvement in growth is equivalent to 5 cents in incremental value
The Benefit to Cost ratio with each 1 percent improvement is therefore 5/0.7 or 7.1
By applying proportionality, a 2 percent increase would generate a 14.2:1 ratio, a 3 percent improvement, a 21.2:1 ratio and the determined 4 percent results in a Benefit to Cost ratio of 28.4:1
Proportionately higher growth rates and improvements in feed conversion efficiency can be attained by increasing the inclusion of HP AviStart, representing a “fast protein” with low levels of anti-nutritional factors. The calculation does not take into account the beneficial effect of improved footpad quality, contributing to incremental revenue as an export product.
HP AviStart is positioned as an ingredient with attributes supported by demonstrated biological mechanisms relating to rapid and efficient absorption of amino acids and diminished effects of anti-nutritional factors. The in vitro studies involving protein kinetics are supported by controlled trials demonstrating an improvement in live weight at harvest, approximating four percent, compared to controls receiving conventional corn-soybean meal diets.
|
U.S Broiler Chick Production-By the Numbers
|
|
 The following production data reflecting calendar month was summarized from the September 23rd 2025 edition of the USDA Chickens and Eggs-: The following production data reflecting calendar month was summarized from the September 23rd 2025 edition of the USDA Chickens and Eggs-:
- August 2025 broiler hatching egg production was 1,186 million, down 2.5 percent from August 2024.
- August 2025 broiler hatch was 878.6 million, up 0.4 percent from August 2024.
- January to August 2025 cumulative broiler hatch was 6,853 million, up 0.6 percent compared to the first eight months of 2025.
- September 1st 2025 broiler hatching eggs in incubators attained 748.5 million, up 1.0 percent from September 1st 2024.
- August 2025 U.S. Broiler parent pullets placed amounted to 8.2 million, down 5.3 percent from August 2024.
- September 1st 2025 broiler parent hen population was 59.9 million, down 2.5 percent from September 1st 2024.
  The take-away from the September report is a transitory reduction in the national breeder flock consistent with improved hatch. The U.S. Industry responds to prevailing domestic and export demand by selecting appropriate capacity in relation to price for a broad range of products The take-away from the September report is a transitory reduction in the national breeder flock consistent with improved hatch. The U.S. Industry responds to prevailing domestic and export demand by selecting appropriate capacity in relation to price for a broad range of products
|
Interview with Erik Visser, CEO of Hamlet Protein
|
|
 Hamlet Protein was founded in 1989 in Denmark to improve the inherent nutritional quality of soybean meal, specifically for immature livestock. The company has continuously emphasized scientific research as a basis for marketing to young animal nutrition solutions for calves, piglets, chicks and poults. Hamlet Protein has developed unique, patented mild temperature enzymatic treatment that results in a feed ingredient with enhanced nutritional quality. Hamlet Protein was founded in 1989 in Denmark to improve the inherent nutritional quality of soybean meal, specifically for immature livestock. The company has continuously emphasized scientific research as a basis for marketing to young animal nutrition solutions for calves, piglets, chicks and poults. Hamlet Protein has developed unique, patented mild temperature enzymatic treatment that results in a feed ingredient with enhanced nutritional quality.
Hamlet Protein partners with feed mills, integrators and farmers, initially in the E.U. but since globally with a production facility located in Findlay, OH and a sales office in China. Hamlet Protein is guided by the principle that healthy profits are derived from healthy animals.
Hamlet Protein scientists collaborate with reputable universities and research centers around the world, and technical representatives cooperate with customers in conducting trials and sharing knowledge.
Recently CHICK-NEWS had the opportunity to discuss world trends in livestock production with CEO Erik Visser who has occupied the position since 2019 and has contributed to expansion of the Company footprint from the EU to include U.S. production and distribution
CHICK-NEWS: Erik, please provide an overview of the current state of World livestock production.
EV: Expansion and profitability will depend strongly on global geopolitical events. There is obvious a disruption resulting from the volatile tariff situation and a clear concern on a further destabilization of global trade. GDP growth in the E.U. is slowing and China – traditionally an import-export market for animal protein and feed ingredient producers - will face head-winds if exports are disrupted.
This said, poultry and aquaculture will be the clear winners in 2026. There will be limited growth in swine production and there are evident problems with beef including restoration of the North American herd and the emergence of New World Screwworm infestation north of the Panama Canal.
CHICK-NEWS: Livestock profitability will be dependent on consumer demand that in turn is influenced by prevailing economic conditions. Your views?
EV: Global real GDP growth is forecast at 3.2 percent over 2025 similar to 2024 but still below the pre-COVID years. Inflation is abating but tariffs are likely to impact this trend. Political developments in main European economies Germany and France will dominate the direction of progress for the EU.
Real GDP growth is expected to recover in Latin America. In contrast Asia remains a bright spot with growth projected at over 5.1 percent.
CHICK-NEWS: Feed is the principal cost in livestock production. What do you envisage for the coming year?
EV: Ukraine as a major exporter continues to supply commodities despite ongoing hostilitiesHamlet Protein expects feed costs to remain relatively stable given this year’s bountiful crops in all producing areas including the Americas.
CHICK-NEWS: Hamlet Protein uses soybean meal as its major input. Do you envisage any shortages?
EV: Brazil is the world's top producer with more than 50 percent of total production emanating from that country and its neighbors, followed by North America with 30 percent of global production.
With record crops in most production areas and reduced demand from China, prices will remain at a moderate level consistent with a plentiful supply.
In the event of a trade war between the U.S. and China, exports from the U.S. will be curtailed although alternative markets may develop. This is good news for the livestock sector.
CHICK-NEWS: Do you envisage other factors influencing production and profitability in the coming year?
EV: Sustainability is a crucial focus especially in the E.U. but is now less prominent in the U.S. policy making. The same could be said of welfare and worker rights. Agriculture is restrained in Europe as a result of ESG regulations despite a further delay in implementing proposed deforestation regulations.
Artificial intelligence has yet to make an impression on livestock production although technologies are under evaluation albeit with limited implementation. The restraint comprises a lack of reliable data to train AI algorithms.
CHICK-NEWS: Do you have any final messages for your constituency?
EV: We believe that attracting the younger generation to livestock production and processing will be critical to the future of all livestock segments of the industry.

With increasing regulations, especially relating to antibiotics, and ongoing financial pressures, efficiency in production must match genetic potential. Accordingly providing young livestock with appropriate diets that are readily digestible to improve feed conversion efficiency will be necessary to maintain profitability.
Hamlet Protein has strong market shares in North America, Europe and Asia and the company footprint will be extended to Latin America, the Middle East and Africa in the coming year. Research on protein kinetics will continue driving the growth and profitability of our diverse client base.
|
Updated USDA-ERS Poultry Meat Projection for September
|
|
 On September 19th 2025 the USDA-Economic Research Service released updated production and consumption data with respect to broilers and turkeys, covering 2024, a projection for 2025 and a forecast for 2026. On September 19th 2025 the USDA-Economic Research Service released updated production and consumption data with respect to broilers and turkeys, covering 2024, a projection for 2025 and a forecast for 2026.
The revised 2025 projection for broiler production is for 47,925 million lbs. (21.785 million metric tons) up 2.0 percent from 2024. USDA projected per capita consumption of 103.0 lbs. (46.8 kg.) for 2025, up 1.9 percent from 2024. Exports will attain 6,506 million lbs. (2.957 million metric tons), 1.6 percent below the previous year.
The 2026 USDA forecast for broiler production will be 48,300 million lbs. (21.955 million metric tons) up 0.8 percent from 2025 with per capita consumption up 0.2 lb. to 103.2 lbs. (46.9 kg). Exports will be 1.6 percent higher compared to 2025 at 6,610 million lbs. (3.005 million metric tons), equivalent to 13.7 percent of production.
Production values for the broiler and turkey segments of the U.S. poultry meat industry are tabulated below:-
|
Parameter
|
2024
(actual)
|
2025
(projection)
|
2026
(forecast)
|
Difference
2024 to 2025
|
|
Broilers
|
|
|
|
|
|
Production (million lbs.)
|
46,994
|
47,925
|
48,300
|
+2.0
|
|
Consumption (lbs. per capita)
|
101.1
|
103.0
|
103.2
|
+1.9
|
|
Exports (million lbs.)
|
6,680
|
6,506
|
6,610
|
-2.6
|
|
Proportion of production (%)
|
14.2
|
13.6
|
13.7
|
-4.2
|
|
|
|
|
|
|
|
Turkeys
|
|
|
|
|
|
Production (million lbs.)
|
5,121
|
4,837
|
5,040
|
-5.6
|
|
Consumption (lbs. per capita)
|
13.8
|
13.1
|
13.4
|
-5.1
|
|
Exports (million lbs.)
|
486
|
417
|
435
|
-14.2
|
|
Proportion of production (%)
|
9.5
|
8.6
|
8.6
|
-9.6
|
Source: Livestock, Dairy and Poultry Outlook released September 19th 2025
 The September USDA report updated projection for the turkey industry for 2025 including annual production of 4,837 million lbs. (2.199 million metric tons), down 5.5 percent from 2024. Consumption in 2025 is projected to be 13.1 lbs. (6.0kg.) per capita, down by 5.1 percent from the previous year. Export volume will attain 417 million lbs. (189,500 metric tons) in 2025. Values for production and consumption of RTC turkey in 2025 are considered to be realistic, given year to date data, the prevailing economy, variable weekly poult placements, production levels, losses from HPAI and inventories consistent with season. The September USDA report updated projection for the turkey industry for 2025 including annual production of 4,837 million lbs. (2.199 million metric tons), down 5.5 percent from 2024. Consumption in 2025 is projected to be 13.1 lbs. (6.0kg.) per capita, down by 5.1 percent from the previous year. Export volume will attain 417 million lbs. (189,500 metric tons) in 2025. Values for production and consumption of RTC turkey in 2025 are considered to be realistic, given year to date data, the prevailing economy, variable weekly poult placements, production levels, losses from HPAI and inventories consistent with season.
The 2026 forecast for turkey production is 5,040 million lbs. (2.291 million metric tons) up an optimistic 4.2 percent from 2025 with per capita consumption up 2.3 percent to 13.4 lbs. (6.1 kg). Exports will be 4.3 percent higher than in 2025 to 435 million lbs. (197,728 metric tons) equivalent to 8.6 percent of production.
Export projections do not allow for a breakdown in trade relations with existing major partners including Mexico, Canada and China nor the impact of catastrophic diseases including HPAI and vvND in either the U.S. or importing nations
|
U.S. Broiler and Turkey Exports, January-July 2025
|
|
 OVERVIEW OVERVIEW
Total exports of bone-in broiler parts and feet during January-July 2025 attained 1,768,136 metric tons, 7.0 percent lower than in January-July 2024 (1,900,254 metric tons). Total value of broiler exports increased by 0.5 percent to $2,654 million ($2,642 million).
Total export volume of turkey products during January-July 2025 attained 104,448 metric tons, 15.6 percent less than in January-July 2024 (123,778 metric tons). Total value of turkey exports increased by 12.9 percent to $316 million ($368 million).
Average unit price attained by the broiler industry is constrained by the fact that leg quarters comprise over 96 percent of broiler meat exports by volume (excluding feet). Leg quarters represent a relatively low-value undifferentiated commodity lacking in pricing power. Exporters of commodities are subjected to competition from domestic production in importing nations. Generic products such as leg quarters are vulnerable to trade disputes and embargos based on real or contrived disease restrictions. To increase sales volume and value the U.S. industry will have to become more customer-centric offering value-added presentations with attributes required by importers. Whether this will increase margins is questionable given that leg quarters are regarded as a by-product of broiler production. A more profitable long-term strategy for the U.S. industry would be to develop products using dark meat to compete with and displace pork and beef in the domestic retail and institutional markets. Due to a shortage and hence high price for beef presentations this opportunity is now evident.
HPAI is now accepted to be panornitic affecting the poultry meat industries of six continents with seasonal and sporadic outbreaks. The incidence rate and location of cases in the U.S. has limited the eligibility for export from many plants depending on restrictions imposed by importing nations. Incident cases in the U.S. have now resumed after a three month hiatus but a resurgence is anticipated during the Fall.
Uncertainty surrounding tariff policy is an added complication potentially impacting export volume in 2025. In the event of reduced exports, leg quarters would be diverted to the domestic market resulting in a depression in average value derived from a processed bird.
To offset an anticipated decline in exports of U.S. agricultural products the USDA will make available $285 million during 2026 for trade promotion including trade reciprocity missions and credit guarantees under the GSM-102 program.
EXPORT VOLUMES AND PRICES FOR BROILER MEAT
The following table prepared from USDA data circulated by the USAPEEC, compares values for poultry meat exports during January-July 2025 compared with the corresponding months during 2024:-
|
PRODUCT
|
Jan.-July 2024
|
Jan.-July 2025
|
DIFFERENCE
|
|
Broiler Meat & Feet
|
|
|
|
|
Volume (metric tons)
|
1,900,254
|
1,768,136
|
-132,118 (-7.0%)
|
|
Value ($ millions)
|
2,642
|
2,654
|
+12 (+0.5%)
|
|
Unit value ($/m. ton)
|
1,390
|
1,501
|
+111 (+8.0%)
|
|
Turkey Meat
|
|
|
|
|
Volume (metric tons)
|
123,748
|
104,448
|
-19,300 (-15.6%)
|
|
Value ($ millions)
|
368
|
416
|
+48 (+13.6%)
|
|
Unit value ($/m. ton)
|
2,973
|
3,983
|
+1.010 (+34.0%)
|
COMPARISON OF U.S. CHICKEN AND TURKEY EXPORTS
JANUARY-JULY 2025 COMPARED TO 2024
BROILER EXPORTS
Total broiler parts, predominantly leg quarters but including feet, exported during January-July 2025 compared with the corresponding months in 2024 declined by 7.0 percent in volume but value was up 0.5 percent. Unit value was 8.0 percent higher to $1,501 per metric ton.
 During 2024 exports attained 3,251,000 metric tons valued at $4,689 million, down 10.5 percent in volume and down 1.1 percent in value compared to 2023. Unit value was up 10.7 percent to $1,442 per metric ton During 2024 exports attained 3,251,000 metric tons valued at $4,689 million, down 10.5 percent in volume and down 1.1 percent in value compared to 2023. Unit value was up 10.7 percent to $1,442 per metric ton
Broiler imports in 2025 are projected to attain an inconsequential 67,000 metric tons (134 million lbs.) compared to 82,000 metric tons (180,000 million lbs.) in 2024
The top five importers of broiler meat represented 51.1 percent of shipments during January-July 2025. The top ten importers comprised 66.5 percent of the total volume reflecting concentration among the significant importing nations.
Eighth-ranked China declined 51.9 percent in volume to 50,717 tons and concurrently by 29.8 percent in value to $165 million over the first seven months of 2025 compared to the corresponding period in 2024. Unit value increased by 45.6 percent to $3,246 per metric ton reflecting the high proportion of feet in consignments
Nations gaining in volume compared to the corresponding period in 2024 (with the percentage change indicated) in descending order of volume with ranking indicated by numeral were:-
3. Taiwan, (+8%); 4. Philippines, (+43%); 5. Canada, (+22%); 10. Haiti, (+31%); 11. Ghana, (+24%); 12, Dominican Rep., (+1%) and 16. Congo-Kinshasa), (+171%)
Losses during January-July 2025 offset the gains in exports with declines for:-
1. Mexico, (-2%); 2. Cuba, (-8%); 6. Guatemala, (-1%); 7. Viet Nam, (-20); 8. China, (-52%); 9. Angola, (-23%); 12. UAE, (-33%); 14. Georgia, (-4%) and Hong Kong, (-44%).
TURKEY EXPORTS
The volume of turkey meat exported during January-July 2025 declined by 15.6 percent to 104,448 metric tons from January-July 2024 but value was 13.6 percent higher at $416 million. Average unit value was 34.0 percent higher at $3,983 per metric ton.
Imports of turkey products attained 15,000 metric tons (33 million lbs.) in 2024 with a similar projection for 2025.
It is important to recognize that exports of chicken and turkey meat products to our USMCA partners amounted to $1,264 million in 2021, $1,647 million during 2022, $1,696 in 2023 and $1,204 million over the first seven-months of 2025. It will be necessary for all three parties to the USMCA to respect the terms of the Agreement in good faith since punitive action against Mexico or Canada on issues unrelated to poultry products will result in reciprocal action by our trading partners to the possible detriment of U.S. agriculture. This is especially important as all three nations have recently elected chief executives and administrations.
The emergence of H5N1strain avian influenza virus with a Eurasian genome in migratory waterfowl in all four Flyways of the U.S. during 2022 was responsible for sporadic outbreaks of avian influenza in backyard flocks and serious commercial losses in egg-producing complexes and turkey flocks but to a lesser extent in broilers. The probability of additional outbreaks of HPAI over succeeding weeks appears likely with recorded outbreaks in turkey farms in ND, SD and MN. Consistent with fall migration of waterfowl. Incident cases affecting egg-production and turkey flocks will be a function of shedding by migratory and domestic birds and possibly free-living mammals or even extension from dairy herds. Protection of commercial flocks at present relies on the intensity and efficiency of biosecurity including wild-bird laser repellant installations, representing investment in structural improvements and operational procedures. These measures are apparently inadequate to provide absolute protection, suggesting the need for preventive vaccination in high-risk areas for egg-producing, breeder and turkey flocks.
The application of restricted county-wide embargos following the limited and regional cases of HPAI in broilers with restoration of eligibility 28 days after decontamination has supported export volume for the U.S. broiler industry. Exports of turkey products were more constrained with plants processing turkeys in Minnesota, the Dakotas, Wisconsin and Iowa impacted. The future challenge will be to gain acceptance for limited preventive vaccination of laying hens and turkeys in high-risk areas accompanied by intensive surveillance. It is now accepted that H5N1 HPAI is panornitic in distribution among commercial and migratory birds across six continents. The infection is now seasonally or regionally endemic in many nations with intensive poultry production, suggesting that vaccination will have to be accepted among trading partners as an adjunct to control measures in accordance with WOAH policy.
The live-bird market system supplying metropolitan areas, the presence of numerous backyard flocks, gamefowl and commercial laying hens allowed outside access, potentially in contact with migratory and now some resident bird species, all represent an ongoing danger to the entire U.S. commercial industry. The live-bird segments of U.S. poultry production represent a risk to the export eligibility of the broiler and turkey industries notwithstanding WOAH compartmentalization for breeders and regionalization (zoning) to counties or states for commercial production.
|
Recent Broiler Production and Trade Data from GAIN Reports
|
|
 Over the past four weeks USDA-FAS has released GAIN reports detailing broiler production, trade and domestic consumption for six nations. Over the past four weeks USDA-FAS has released GAIN reports detailing broiler production, trade and domestic consumption for six nations.
The following table projects data for the industries in the six nations covering 2026
|
Nation
|
Mexico
|
Turkey
|
Argentine
|
Philippines
|
Ukraine
|
S. Korea
|
|
Production*
|
4,150
|
2,900
|
2,575
|
1,810
|
1,440
|
925
|
|
Imports*
|
1,150
|
0
|
30
|
560
|
40
|
250
|
|
Exports*
|
5
|
445
|
150
|
0
|
490
|
1,175
|
|
Domestic*
Consumption
|
5,285
|
2,455
|
2,455
|
2,375
|
990
|
1,110
|
|
Per capita (kg.)
|
40.3
|
28.5
|
53.4
|
20.4
|
17.1
|
21.3
|
|
Consumption (lbs.)
|
88.7
|
62.7
|
117.5
|
45.0
|
37.6
|
46.9
|
*Thousand metric tons
National RTC Production, Trade and Consumption Data
|
USPOULTRY Foundation Selects Topics for Research
|
|
 According to a September 22nd release, USPOULTRY and the associated Foundation have suggested topics in their solicitation for research funding. The Board Research Initiative has highlighted the following diseases:- According to a September 22nd release, USPOULTRY and the associated Foundation have suggested topics in their solicitation for research funding. The Board Research Initiative has highlighted the following diseases:-
- Control of histomoniasis (“blackhead”) in turkeys and chickens
- Control of turkey coronavirus (TCV)
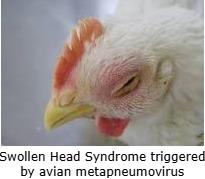
- Developing effective vaccination strategies for avian metapneumovirus
Requests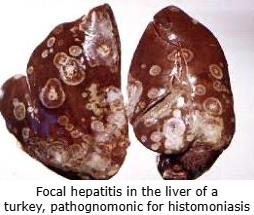 for proposals released by USPOULTRY and also the USDA reflect emerging and ongoing diseases and conditions of clinical and economic importance in the poultry industry. for proposals released by USPOULTRY and also the USDA reflect emerging and ongoing diseases and conditions of clinical and economic importance in the poultry industry.
|
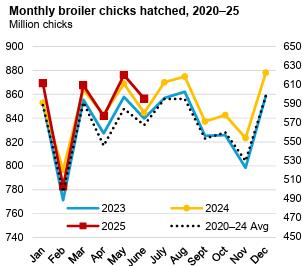
Monthly Broiler Production Statistics, August-September 2024
|
|
Broiler Chick Placements August-September-July 2025.
According to the September 24th 2025 USDA Broiler Hatchery Report, 1.239 million eggs were set over five weeks extending from August 23rd 2025 through September 20th 2025 inclusive. This was three percent higher compared to the corresponding period in 2024.
Total chick placements for the U.S. over the five-week period amounted to 971.0 million chicks. Claimed hatchability for the period averaged 79.7 percent for eggs set three weeks earlier. Each 1.0 percent change in hatchability represents approximately 1.94 million chicks placed per week and 1.84 million broilers processed, assuming five percent culls and mortality and within the current range of weekly settings.
Cumulative chick placements for the period January 7th through December 30th 2024 amounted to 9.67 billion chicks. For January 4th through September 20th 2025 chick placements attained 7.32 billion, up one percent from the corresponding week in 2024.
According to the September 22nd 2025 edition of USDA Chickens and Eggs, pullet breeder chicks hatched and intended for U.S. placement during August 2025 amounted to 8.24 million, down 5.3 percent (0.46 million pullet chicks) from August 2024 and 0.7 percent (61,000 pullet chicks) less than the previous month of July 2025. Broiler breeder hen complement attained 59.94 million on September 1st 2025, 2.5 percent (1.56 million hens) down from September 1st 2024 and 0.3 percent (180,000 hens) lower than August 1st 2025.
Broiler Production September 2025
As documented in the September 25th 2025 USDA Weekly Poultry Slaughter Reports for the processing week ending September 20th 2025, 175.0 million broilers were processed at 6.70 lbs. live. This was 2.5 percent more than the 170.8 million processed during the corresponding week in September 2024. Broilers processed in 2025 to date amounted to 6,242 million, 2.1 percent more than for the corresponding period in 2024.
Ready to cook (RTC) weight for the most recent week in September was 903.0 million lbs. (410,462 metric tons). This was 3.8 percent more than the 870.0 million lbs. during the corresponding week in September 2024. Dressing percentage was a nominal 76.0 percent. For 2025 to date RTC broiler production attained 31,704 million lbs. (15.078 million metric tons). This quantity was 3.5 percent more than for the corresponding period in 2024.
The USDA posted live-weight data for the past week ending September 20th and YTD 2025 including:-
|
Live Weight Range (lbs.)
|
<4.25
|
4.26-6.25
|
6.26-7.25
|
>7.76
|
|
Proportion past week (%)
|
14
|
28
|
28
|
30
|
|
Change from 2020 YTD (%)
|
-8
|
+2
|
0
|
+11
|
September 2025 Frozen Inventory
According to the September 25th 2025 USDA Cold Storage Report, issued monthly, stocks of broiler products as of August 31st 2025 compared to August 31st 2024 showed differences with respect to the following categories:-
- Total Chicken category attained 790.9 million lbs. (359.5 thousand metric tons) corresponding to approximately one week of production based on recent weekly RTC output. The August 2025 inventory was up 4.3 percent compared to 758,551 million lbs. (344.8 thousand metric tons) on August 31st 2024 and up 1.9 percent from the previous month of July 2025.
- Leg Quarters were down 9.0 percent to 56.9 million lbs. compared to August 31st 2024 consistent with the data on exports. Inventory was up 2.0 percent from July 31st 2025. Given the trend in inventory of leg quarters it is evident that this category continues to be shipped in varying quantities as the principal (96 percent) chicken export product to a number of nations with the top five importers representing 51.1 percent of the January-July 2025 export total of 1,768,136 metric tons of chicken parts. The top ten importing nations represented 66.5 percent of broiler exports with Mexico was the leading importer followed by Cuba Taiwan, the Philippines, and Canada.
- The Breasts and Breast Meat category was up 17.1 percent from August 31st 2024 to 240.5 million lbs. indicating a relatively lower domestic consumer demand for this category despite concern over inflation in the cost of alternative proteins. August 31st 2025 stock was 1.1 percent lower than on July 31st 2025. The trend through the first eight months of 2025 suggests stable but low retail and food service demand for the white meat category. This is despite promotion of chicken sandwiches and wraps by QSRs in the face of a higher cost for beef coupled with an increasing pattern of eat-at-home consumption.
- Total inventory of dark meat (drumsticks legs, thighs and thigh quarters but excluding leg quarters) on August 31st 2025 decreased 2.9 percent from August 31st 2024 to 60.9 million lbs. This difference suggests an increase in domestic demand for lower-priced dark meat against the prevailing price of white chicken meat. Higher prices for competitive proteins offer an opportunity to increase domestic demand for this category with innovative product development and promotion.
- Wings showed a 7.2 percent decrease from August 2024, contributing to a stock of 55.4 million lbs. Inventory of wings was 5.7 percent higher compared to July 2025. Movement in stock over the past 12 months has demonstrated lower demand for this category due in part from competitive “boneless wings.” Increased consumption traditionally associated with significant sports events including the College and Super Bowls reduced the volumes of storage in January and February 2025. The progressive increase in unit price during 2024 plateaued in 2025 due to consumer fatigue and competition from competing protein snacks despite continued interest in professional and collegiate football.
- The inventory of Paws and Feet was 4.7 percent higher than on August 31st 2024 to 29.9 million lbs. Stock was was 9.6 percent higher than on July 31st 2025. Prior to the April 2020 Phase-1 Trade Agreement approximately half of the shipments of paws and feet destined for Hong Kong were landed and transshipped to the Mainland, a trend that is re-emerging.
- The Other category comprising 330.0 million lbs. on August 31st 2025 was down 1.0 percent from August 2024 but represented a substantial 41.7 percent of inventory. The high proportion of the Other category suggests further classification or re-allocation by USDA to the designated major categories.
August 2025 Processed Broiler Production
The USDA Poultry Slaughter Report released on September 25th 2025 covered August 2025 comprising 21 working days, one less than August 2024. The following values were documented for the month:-
- A total of 797.2 million broilers were processed in August 2025, down 17.1 million or 2.1 percent from August 2024;
- Total live weight in August 2025 was 5,304 million lbs., down 38.7 million lbs. or 0.7 percent from August 2024;
- Unit live weight in August 2025 was 6.65 lbs., up 0.09lb. (1.4 percent) from August 2024.
- RTC in August 2025 attained 4,021 million lbs., down 17.8 million lbs. or 0.4 percent from August 2004.
- WOG yield in August 2025 was 75.8 percent, up from 75.6 percent in August 2024.
- The proportion marketed as chilled in August 2025 comprised 93.4 percent of RTC output compared to 93.6 percent in August 2024.
- Ante-mortem condemnation as a proportion of live weight attained 0.19 percent during August 2025 unchanged from 0.19 percent in August 2024.
- Post-mortem condemnations as a proportion of processed mass corresponded to 0.43 percent during August 2025 compared to 0.44 percent in August 2024.
Comments
Mexico has recognized the OIE principle of regionalization after intensive negotiations between SENASICA and the U.S. counterpart, USDA-APHIS assisted by USAPEEC. Provided importing nations adhere to OIE guidelines on regionalization, localized outbreaks of avian influenza or possibly Newcastle disease will affect exports only from states or counties with outbreaks in commercial flocks. The response of China, Japan and some other nations is less predictable with bans placed on a nationwide or statewide basis. The response by China to outbreaks is influenced more by self-interest than considerations of scientific fact or international trade obligations. Other importing nations have confined restrictions to counties following the WOAH principle of regionalization. The challenge facing the U.S. as the second largest exporting nation after Brazil, will be to gain acceptance for controlled vaccination against HPAI in specific industry sectors and regions with appropriate surveillance and certification to the satisfaction of importing nations.
|
|
Shane Commentary
|
|
|
|
|