
|

Poultry Industry Statistics and Reports
|
Monthly Broiler Production Statistics, January-February
|
02/25/2026 |
|
Broiler Chick Placements, January-February 2026
According to the February 18th 2026 USDA Broiler Hatchery Report, 1,268 million eggs were set over five weeks extending from January 17th through February 14th 2026 inclusive. This was approximately two percent higher compared to the corresponding period in 2025.
Total chick placements for the U.S. over the five-week period amounted to 979 million chicks. Claimed hatchability for the period averaged 79.2 percent for eggs set three weeks earlier. Each 1.0 percent change in hatchability represents approximately 1.96 million chicks placed per week and 1.86 million broilers processed, assuming five percent culls and mortality and within the current range of weekly settings.
Cumulative chick placements for the period January 4th through December 27th 2025 amounted to 10.00 billion chicks up approximately one percent from calendar 2024. Chick placements for 2026 to date have attained 1.18 billionin 2026 to date, up two percent from the corresponding period in 2025.
According to the February 23rd 2025 edition of USDA Chickens and Eggs, pullet breeder chicks hatched and intended for U.S. placement during January 2026 amounted to 8.10 million, up 4.2 percent (0.36 million pullet chicks) from January 2025. Broiler breeder hen complement attained 60.55 million on February 1st 2026, 2.2 percent (1.38 million hens) down from January 2025 but 0.6 percent (343,000 hens) higher than January 2026.
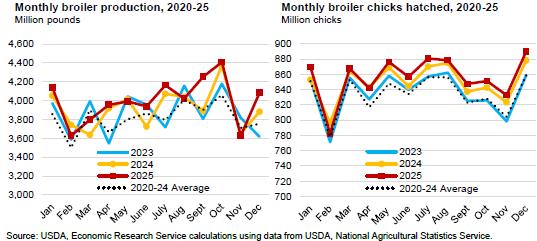
Broiler Production 2026
As documented in the February 19th 2026 USDA Weekly Poultry Slaughter Reports for the processing week ending February 14th 2026, 172.2 million broilers were processed at 6.52 lbs. live. This was 3.5 percent more than the 166.8 million processed during the corresponding week in February 2025. Broilers processed in 2026 to date amounted to 1.117 million, 4.0 percent less than the 1.131 million during the corresponding period in 2025.

Ready to cook (RTC) weight for the most recent week in February was 853.2 million lbs. (386,925 metric tons). This was 2.8 percent more than the 830.1 million lbs. during the corresponding week in February 2025. Dressing percentage was a nominal 76.0 percent. For 2026 to date RTC broiler production attained 5,888 million lbs. (2.670 million metric tons). This quantity was 3.6 percent more than for the corresponding period in 2025.
The USDA posted live-weight data for the past week ending February 14th and YTD 2026 including:-
|
Live Weight Range (lbs.)
|
<4.25
|
4.26-6.25
|
6.26-7.25
|
>7.76
|
|
Proportion past week (%)
|
14
|
34
|
22
|
30
|
|
Change from 2020 YTD (%)
|
-1
|
0
|
+9
|
+7
|
November 2025 Frozen Inventory
According to the February 24th 2026 USDA Cold Storage Report, stocks of broiler products as of January 31st 2026 compared to January 31st 2025 showed differences with respect to the following categories:-
- Total Chicken category attained 794.7 million lbs. (360.4 thousand metric tons) corresponding to approximately one week of production based on recent weekly RTC output. The January 31st 2026 inventory was down 1.2 percent compared to 803,966 million lbs. (346.6 thousand metric tons) on January 31st 2025 and down 3.7 percent from the previous month of December 2025.
- LegQuarters were down 27.6 percent to 47.8 million lbs. compared to January 31st 2025 consistent with the data on exports. Inventory was down 6.7 percent from December 31st Given the trend in inventory of leg quarters it is evident that this category continues to be shipped in varying quantities as the principal (96 percent) chicken export product to a number of nations.
- The Breasts and Breast Meat category was down 5.9 percent from January 31st 2025 to 234.1 million lbs. indicating a relatively higher domestic consumer demand for this category possibly reflecting concern over inflation in the cost of alternative proteins. The January 31st 2026 stock level was 4.1 percent lower than December 31st The trend through 2025 suggests stable retail and food service demand for the white meat category. This is despite promotion of chicken sandwiches and wraps by QSRs in the face of a higher cost for beef coupled with an increasing pattern of eat-at-home consumption.
- Total inventory of dark meat (drumsticks legs, thighs and thigh quarters but excluding leg quarters) on January 31st 2026 decreased 8.3 percent from January 31st 2025 to 64.1 million lbs. This difference suggests an increase in domestic demand for lower-priced dark meat against the prevailing price of white chicken meat. Higher prices for competitive proteins offer an opportunity to increase domestic demand for this category with innovative product development and promotion.
- Wings showed a 6.2 percent decrease from January 31st 2025, contributing to a stock of 50.7 million lbs. Inventory of wings was 7.7 percent lower compared to the end of December 2025. Movement in stock over the past 12 months has demonstrated slightly higher demand for this category despite competition from “boneless wings.” Increased consumption traditionally associated with significant sports events including College bowls and the NFL Super Bowl traditionally reduce the volumes of storage in January and February. Unit price increased progressively during 2024 but plateaued in 2025 due to consumer fatigue and competition from competing protein snacks despite continued interest in professional and collegiate football.
- The inventory of Paws and Feet was 21.2 percent lower than on January 31st 2025 to 27.1 million lbs. Stock was 1.6 percent lower than on December 31st Prior to the April 2020 Phase-1 Trade Agreement approximately half of the shipments of paws and feet destined for Hong Kong were landed and transshipped to the Mainland, a trend that is re-emerging.
- The Other category comprising 347.6 million lbs. on January 31st 2026 was up 10.2 percent from January 31st 2025 but represented a substantial 42.7 percent of inventory. The high proportion of the Other category suggests further classification or re-allocation by USDA to the designated major categories.
January 2026 Processed Broiler Production
The monthly USDA Poultry Slaughter Report was released on February 20th 2025 covering January 2026. The month comprised 22 week-days, one less than January 2025. The following values were documented for the month of January 2026:-
- A total of 799.1 million broilers were processed in January 2026, down 25.1 million or 3.0 percent from January 2025;
- Total live weight in January 2026 was 5,324 million lbs., down 155.8 million lbs. or 2.8 percent from January 2025;
- Unit live weight in January 2026 was 6.66 lbs., up 0.01lb. (0.2 percent) from January 2025.
- RTC in January2026 attained 4,033 million lbs., down 107.3 million lbs. or 2.6 percent from January 2006.
- WOG yield in January 2026 was 75.8 percent, up from 75.6 percent in January 2025.
- The proportion marketed as chilled in January 2026 comprised 93.2 percent of RTC output compared to 93.6 percent in January 2025.
- Ante-mortem condemnation as a proportion of live weight attained 0.21 percent during January 2026 unchanged from January 2025.
- Post-mortem condemnations as a proportion of processed mass corresponded to 0.45 percent during January 2026 compared to 0.48 percent in January 2025.
Comments
Mexico has recognized the OIE principle of regionalization after intensive negotiations between SENASICA and the U.S. counterpart, USDA-APHIS assisted by USAPEEC. Provided importing nations adhere to OIE guidelines on regionalization, localized outbreaks of avian influenza or possibly Newcastle disease will affect exports only from states or counties with outbreaks in commercial flocks. The response of China, Japan and some other nations is less predictable with bans placed on a nationwide or statewide basis. The response by China to outbreaks is influenced more by self-interest than considerations of scientific fact or international trade obligations. Other importing nations have confined restrictions to counties following the WOAH principle of regionalization. The challenge facing the U.S. as the second largest exporting nation after Brazil, will be to gain acceptance for controlled vaccination against HPAI in specific industry sectors and regions with appropriate surveillance and certification to the satisfaction of importing nations.
 |

|
U.S. Broiler and Turkey Exports, January Through November 2025
|
02/18/2026 |
|

OVERVIEW
Total exports of bone-in broiler parts and feet during January-November 2025 attained 2,868,161 metric tons, 4.0 percent lower than in January-November 2024 (2,986,653 metric tons). Total value of broiler exports decreased by 0.6 percent to $4,281 million ($4,307 million).
Total export volume of turkey products during January-November 2025 attained 173,676 metric tons, 14.8 percent less than in January-November 2024 (203,861 metric tons). Total value of turkey exports increased by 15.9 percent to $715 million ($617 million).
Average unit price attained by the broiler industry is constrained by the fact that leg quarters comprise over 96 percent of broiler meat exports by volume (excluding feet). Leg quarters represent a relatively low-value undifferentiated commodity lacking in pricing power. Exporters of commodities are subjected to competition from domestic production in importing nations. Generic products such as leg quarters are vulnerable to trade disputes and embargos based on real or contrived disease restrictions. To increase sales volume and value the U.S. industry will have to become more customer-centric offering value-added presentations with attributes required by importers. Whether this will increase margins is questionable given that leg quarters are regarded by U.S. integrators as a by-product of broiler production. A more profitable long-term strategy for the U.S. industry would be to develop products using dark meat to compete with and displace pork and beef in the domestic retail and institutional markets. Due to a shortage and hence high price for beef products this opportunity is now evident.
HPAI is now accepted to be panornitic affecting the poultry meat industries of six continents with seasonal and sporadic outbreaks. The incidence rate and location of cases in the U.S. has limited the eligibility for export from many plants depending on restrictions imposed by importing nations. Incident cases in the U.S. continued at a low rate in egg-production flocks and in turkeys during late 2025 but a resurgence is evident during the first quarter of 2026.
Uncertainty surrounding tariff policy is an added complication potentially impacting export volume in 2026. In the event of reduced exports, leg quarters would be diverted to the domestic market resulting in a depression in average value derived from a processed bird.
To offset an anticipated decline in exports of U.S. agricultural products the USDA will make available $285 million during 2026 for trade promotion including trade reciprocity missions and credit guarantees under the GSM-102 program. The USAPEEC received $7.0 million for export promotion for FY 2026. Of this total, $5.8 million was through the Market Access Program (MAP) and $1.2 million through the Foreign Market Development Program (FMDP). For FY 2026 The USDA will distribute $181 million among 68 industry associations under the MAP and $31 million under the FMDP to 18 organizations.
EXPORT VOLUMES AND PRICES FOR BROILER MEAT
During 2025 the National Chicken Council (NCC), citing USDA-FAS data, documented exports of 3,171,206 metric tons of chicken parts and other forms (whole and prepared), down 3.8 percent from January-December 2024. Exports were valued at $4,764 million with a weighted average unit value of $1,503 per metric ton.
The NCC breakdown of chicken exports for 2025 by proportion and unit price for each category compared with the corresponding months in 2024 (with the unit price in parentheses) comprised:-
- Chicken parts (excluding feet) 1%; Unit value $1,395 per metric ton ($1,365)
- Prepared chicken 0%; Unit value $4,640 per metric ton ($4,244)
- Whole chicken 9%; Unit value $1,688 per metric ton ($1,755)
- Composite Total 0%; Av. value $1,503 per metric ton ($1,466)
The following table prepared from USDA data circulated by the USAPEEC, compares values for poultry meat exports during January-November 2025 compared with the corresponding months during 2024:-
|
PRODUCT
|
Jan.-Nov. 2024
|
Jan.-Nov. 2025
|
DIFFERENCE
|
|
Broiler Meat & Feet
|
|
|
|
|
Volume (metric tons)
|
2,986,653
|
2,868,161
|
-118,492 (-4.0%)
|
|
Value ($ millions)
|
4,307
|
4,281
|
-26 (-0.6%)
|
|
Unit value ($/m. ton)
|
1,442
|
1,492
|
+50 (+3.5%)
|
|
Turkey Meat
|
|
|
|
|
Volume (metric tons)
|
203,861
|
173,626
|
-30,235 (-14.8%)
|
|
Value ($ millions)
|
617
|
715
|
+101 (+16.5%)
|
|
Unit value ($/m. ton)
|
3,027
|
4,118
|
+1,091 (+36.0%)
|
COMPARISON OF U.S. CHICKEN AND TURKEY EXPORTS
JANUARY-NOVEMBER 2025 COMPARED TO 2024
BROILER EXPORTS

Total broiler parts, predominantly leg quarters but including feet, exported during January-November 2025 compared with the corresponding months in 2024 declined by 4.0 percent in volume and value was down 0.6 percent. Unit value was 3.5 percent higher to $1,492 per metric ton.
For comparison during 2024 exports attained 3,251,000 metric tons valued at $4,689 million, down 10.5 percent in volume and down 1.1 percent in value compared to 2023. Unit value was up 10.7 percent to $1,442 per metric ton
Broiler imports in 2025 are projected to attain an inconsequential 67,000 metric tons (134 million lbs.) compared to 82,000 metric tons (180,000 million lbs.) in 2024
The top five importers of broiler meat represented 50.2 percent of shipments during January-November 2025. The top ten importers comprised 66.2 percent of the total volume reflecting concentration among the significant importing nations.
Third-ranked Cuba imported 209,639 metric tons over 11 months representing 7.3 percent of shipments that were valued at $265 million with a unit price of $1,264 per metric ton. Volume and value were respectively 7.3 and 6.4 percent lower than for the corresponding period in 2024. Continued trade with Cuba is imperiled by declining economic strength. Their capicity to import was recently exacerbated by the energy crisis resulting from action in Venezuela and U.S. policy on the supply of fuel to the nation.
Eighth-ranked China declined 44.7 percent in volume to 85,183 tons and concurrently by 31.3 percent in value to $262 million over the first eleven months of 2025 compared to the corresponding period in 2024. Unit value increased by 15.0 percent to $3,075 per metric ton reflecting the high proportion of feet in consignments
Nations gaining in volume compared to the corresponding period in 2024 (with the percentage change indicated) in descending order of volume with ranking indicated by numeral were:-
- Taiwan, (+29%); 4. Philippines, (+29%); 5. Canada, (+12%); 10. UAE, (+5); 11.Ghana, (+18%); 12. Haiti, (+25%); 13, Dominican Rep., (+5%) and 16. Congo-Kinshasa), (+101%)
Losses during January-November 2025 offset the gains in exports with declines for:-
- Mexico, (-7%); 3. Cuba, (-9%); 6. Guatemala, (-2%); 7. Angola, (-15%);
- China, (-45%); 9. Viet Nam, (-33); 14. Hong Kong, (-36%) and 15. Columbia, (-2 %).
TURKEY EXPORTS
The volume of turkey meat exported during January-November 2025 declined by 14.8 percent to 173,676 metric tons from the 11 months of 2024 but value was 15.9 percent higher at $715 million. Average unit value was 36.0 percent higher at $4,115 per metric ton.
Imports of turkey products attained 15,000 metric tons (33 million lbs.) in 2024 with a similar projection for 2025.
Mexico imported 137,717 tons during the 11-month period representing 79.3 percent of volume. Value attained $578 million comprising 79.5 percent of revenue at a unit price of $4,124 per ton. Canada imported 5,654 tons (3.3 percent of exports) valued at $20 million with a unit price of $3,573 per ton.
It is important to recognize that exports of chicken and turkey meat products to our USMCA partners amounted to $1,264 million in 2021, $1,647 million during 2022, $1,696 in 2023 and $1,887 million over the first eleven months of 2025. It will be necessary for all three parties to the USMCA to respect the terms of the Agreement in good faith since punitive action against Mexico or Canada on issues unrelated to poultry products will result in reciprocal action by our trading partners to the possible detriment of U.S. agriculture.
The emergence of H5N1strain avian influenza virus with a Eurasian genome in migratory waterfowl in all four Flyways of the U.S. during 2022 was responsible for sporadic outbreaks of avian influenza in backyard flocks and serious commercial losses in egg-producing complexes and turkey flocks but to a lesser extent in broilers. The probability of additional outbreaks of HPAI over succeeding weeks appears likely with recorded outbreaks in turkey farms in ND, SD and MN. Consistent with fall migration of waterfowl. Incident cases affecting egg-production and turkey flocks will be a function of shedding by migratory and domestic birds and possibly free-living mammals or even extension from dairy herds. Protection of commercial flocks at present relies on the intensity and efficiency of biosecurity including wild-bird laser repellant installations, representing investment in structural improvements and operational procedures. These measures are apparently inadequate to provide absolute protection, suggesting the need for preventive vaccination in high-risk areas for egg-producing, breeder and turkey flocks.
The application of restricted county-wide embargos following the limited and regional cases of HPAI in broilers with restoration of eligibility 28 days after decontamination has supported export volume for the U.S. broiler industry. Exports of turkey products were more constrained with plants processing turkeys in Minnesota, the Dakotas, Wisconsin and Iowa impacted. The future challenge will be to gain acceptance for limited preventive vaccination of laying hens and turkeys in high-risk areas accompanied by intensive surveillance. It is now accepted that H5N1 HPAI is panornitic in distribution among commercial and migratory birds across six continents. The infection is now seasonally or regionally endemic in many nations with intensive poultry production, suggesting that vaccination will have to be accepted among trading partners as an adjunct to control measures in accordance with WOAH policy.
The live-bird market system supplying metropolitan areas, the presence of numerous backyard flocks, gamefowl and commercial laying hens allowed outside access, potentially in contact with migratory and now some resident bird species, all represent an ongoing danger to the entire U.S. commercial industry. The live-bird segments of U.S. poultry production represent a risk to the export eligibility of the broiler and turkey industries notwithstanding WOAH compartmentalization for breeders and regionalization (zoning) to counties or states for commercial production.
|
Updated USDA-ERS February 2026 Poultry Meat Projection
|
02/17/2026 |
|
 On February 17th 2026 the USDA-Economic Research Service released updated production and consumption data with respect to broilers and turkeys, covering actual 2024, a projection for 2025 and a forecast for 2026. On February 17th 2026 the USDA-Economic Research Service released updated production and consumption data with respect to broilers and turkeys, covering actual 2024, a projection for 2025 and a forecast for 2026.
The revised 2025 projection for broiler production is for 48,003 million lbs. (21.770 million metric tons) up 2.1 percent from 2024. USDA projected per capita consumption of 102.9 lbs. (45.7 kg.) for 2025, up 1.8 percent from 2024. Exports will attain 6,660 million lbs. (3.020 million metric tons), 0.3 percent below the previous year.
The 2026 USDA forecast for broiler production will be 48,500 million lbs. (21.996 million metric tons) up 1.0 percent from 2025 with per capita consumption up 0.9 percent to 103.8 lbs. (46.6 kg). Exports will be 1.5 percent higher compared to 2025 at 6,670 million lbs. (3.025 million metric tons), equivalent to 13.8 percent of production.
Production values for the broiler and turkey segments of the U.S. poultry meat industry are tabulated below:-
|
Parameter
|
2024
(actual)
|
2025
(projection)
|
2026
(forecast)
|
Difference
2024 to 2025
|
|
Broilers
|
|
|
|
|
|
Production (million lbs.)
|
46,994
|
48,003
|
48,500
|
+2.1
|
|
Consumption (lbs. per capita)
|
101.1
|
102.9
|
103.8
|
+1.8
|
|
Exports (million lbs.)
|
6,680
|
6,660
|
6,670
|
-0.3
|
|
Proportion of production (%)
|
14.2
|
13.9
|
13.8
|
-2.1
|
| |
|
|
|
|
|
Turkeys
|
|
|
|
|
|
Production (million lbs.)
|
5,121
|
4,844
|
4,965
|
-5.4
|
|
Consumption (lbs. per capita)
|
13.8
|
13.2
|
13.4
|
-4.5
|
|
Exports (million lbs.)
|
486
|
417
|
400
|
-14.1
|
|
Proportion of production (%)
|
9.5
|
8.6
|
8.1
|
-9.5
|
Source: Livestock, Dairy and Poultry Outlook released Feb 17th 2026
The February 17th USDA report updated the projection for the turkey industry during 2025 including annual production of 4,844 million lbs. (2.197 million metric tons), down 5.4 percent from 2024. Consumption in 2025 is projected to be 13.2 lbs. (6.0kg.) per capita, down by 4.3 percent from the previous year. Export volume will attain 417 million lbs. (189,116 metric tons) in 2025. Values for production and consumption of RTC turkey in 2025 and 2026 are considered to be realistic, given year to date data, the prevailing economy, variable weekly poult placements, trends in production levels, losses from HPAI and inventories consistent with season.
The 2026 forecast for turkey production is 4,965 million lbs. (2.251 million metric tons) up an optimistic 2.5 percent from 2025 with per capita consumption up 1.5 percent to 13.4 lbs. (6.1 kg). Exports will be 4.1 percent lower than in 2025 to 400 million lbs. (181,406 metric tons) equivalent to 8.0 percent of production. This implies a reduction in selling prices for whole birds and products
Export projections do not allow for a breakdown in trade relations with existing major partners including Mexico, Canada and China nor the impact of catastrophic diseases including HPAI and vvND in either the U.S. or importing nations
|
Monthly Broiler Production Statistics, December-January.
|
01/20/2026 |
|
Broiler Chick Placements December 2025-January 2026
 According to the January 14th 2026 USDA Broiler Hatchery Report, 1,510 million eggs were set over six weeks extending from December 6th 2025 through January 10th 2026 inclusive. This was approximately one percent higher compared to the corresponding period in 2024/5. According to the January 14th 2026 USDA Broiler Hatchery Report, 1,510 million eggs were set over six weeks extending from December 6th 2025 through January 10th 2026 inclusive. This was approximately one percent higher compared to the corresponding period in 2024/5.
Total chick placements for the U.S. over the six-week period amounted to 1,177 million chicks. Claimed hatchability for the period averaged 79.7 percent for eggs set three weeks earlier. Each 1.0 percent change in hatchability represents approximately 1.93 million chicks placed per week and 1.83 million broilers processed, assuming five percent culls and mortality and within the current range of weekly settings.
Cumulative chick placements for the period January 4th through December 27th 2025 amounted to 10.00 billion chicks up approximately one percent from calendar 2024. For the first two hatch weeks of 2026 chick placements attained 0.39 billion, up one percent from the corresponding value in 2025.
According to the December 19th 2025 edition of USDA Chickens and Eggs, pullet breeder chicks hatched and intended for U.S. placement during November 2025 amounted to 8.08 million, down 2.2 percent (0.19 million pullet chicks) from November 2024 and 3.7 percent (288,000 pullet chicks) more than the previous month of October 2025. Broiler breeder hen complement attained 59.82 million in November 2025, 1.6 percent (1.00 million hens) down from December 2024 and 1.7 percent (988,000 hens) higher than October 2025.

Broiler Production 2026
As documented in the January 15th 2026 USDA Weekly Poultry Slaughter Reports for the processing week ending January 10th 2025, 173.6 million broilers were processed at 6.69 lbs. live. This was 12.7 percent more than the 154.1 million processed during the corresponding week in January 2025, constrained by holiday schedule. Broilers processed for the first two weeks in 2026 amounted to 0.32 million, 10.1percent more than for the corresponding period in 2025.
Ready to cook (RTC) weight for the most recent week in January was 881.6 million lbs. (400,727 metric tons). This was 12.6 percent more than the 783.2 million lbs. during the corresponding week in January 2025. Dressing percentage was a nominal 76.0 percent. For 2026 to date RTC broiler production attained 1,603 million lbs. (0,728 million metric tons). This quantity was 8.7 percent more than for the corresponding period in 2024.
The USDA posted live-weight data for the past week ending January 10th and YTD 2026 including:-
|
Live Weight Range (lbs.)
|
<4.25
|
4.26-6.25
|
6.26-7.25
|
>7.76
|
|
Proportion past week (%)
|
16
|
27
|
25
|
32
|
|
Change from 2020 YTD (%)
|
0
|
+2
|
+32
|
+6
|
Inventory and processing data for December 2025 has yet to be released by USDA at the time of compilation of this report
November 2025 Frozen Inventory
According to the December 23rd 2025 USDA Cold Storage Report, the first to be released after the Federal shutdown, stocks of broiler products as of November 30th 2025 compared to November 30th 2024 showed differences with respect to the following categories:-
- Total Chicken category attained 814.9 million lbs. (370.4 thousand metric tons) corresponding to approximately one week of production based on recent weekly RTC output. The November 2025 inventory was up 0.7 percent compared to 809,039 million lbs. (368.8 thousand metric tons) on November 30th 2024 and up 0.4 percent from the previous month of October 2025.
- Leg Quarters were down 16.0 percent to 55.6 million lbs. compared to November 30th 2024 consistent with the data on exports. Inventory was up 2.0 percent from July 31st 2025. Given the trend in inventory of leg quarters it is evident that this category continues to be shipped in varying quantities as the principal (96 percent) chicken export product to a number of nations.
- The Breasts and Breast Meat category was up 2.8 percent from November 30th 2024 to 242.1 million lbs. indicating a relatively lower domestic consumer demand for this category despite concern over inflation in the cost of alternative proteins. The November 30th 2025 stock level was 2.1 percent higher than October 31st 2025. The trend through the first eleven months of 2025 suggests stable but low retail and food service demand for the white meat category. This is despite promotion of chicken sandwiches and wraps by QSRs in the face of a higher cost for beef coupled with an increasing pattern of eat-at-home consumption.
- Total inventory of dark meat (drumsticks legs, thighs and thigh quarters but excluding leg quarters) on November 30th 2025 decreased 3.6 percent from November 30th 2024 to 65.9 million lbs. This difference suggests an increase in domestic demand for lower-priced dark meat against the prevailing price of white chicken meat. Higher prices for competitive proteins offer an opportunity to increase domestic demand for this category with innovative product development and promotion.
- Wings showed a 3.8 percent decrease from November 30th 2024, contributing to a stock of 57.1 million lbs. Inventory of wings was 5.2 percent lower compared to the end of October 2025. Movement in stock over the past 12 months has demonstrated slightly higher demand for this category despite competition from “boneless wings.” Increased consumption traditionally associated with significant sports events including the College and Super Bowls reduced the volumes of storage in January and February 2025. The progressive increase in unit price during 2024 plateaued in 2025 due to consumer fatigue and competition from competing protein snacks despite continued interest in professional and collegiate football.
- The inventory of Paws and Feet was 15.8 percent lower than on November 30th 2024 to 27.6 million lbs. Stock was 3.0 percent higher than on October 31st 2025. Prior to the April 2020 Phase-1 Trade Agreement approximately half of the shipments of paws and feet destined for Hong Kong were landed and transshipped to the Mainland, a trend that is re-emerging.
- The Other category comprising 345.0 million lbs. on November 30th 2025 was up 4.1 percent from November 30th 2024 but represented a substantial 42.3 percent of inventory. The high proportion of the Other category suggests further classification or re-allocation by USDA to the designated major categories.
November 2025 Processed Broiler Production
The delayed monthly USDA Poultry Slaughter Report was released on December 5th 2025 covering October 2025, with the NASS having skipped September due to the Federal shutdown in October. The month comprised 23 working days, the same as November 2024. The following values were documented for the month of October:-
- A total of 870.1 million broilers were processed in October 2025, up 8.4 million or 1.0 percent from August 2024;
- Total live weight in August 2025 was 5,304 million lbs., down 38.7 million lbs. or 0.7 percent from October 2024;
- Unit live weight in October 2025 was 6.72 lbs., up 0.02lb. (0.3 percent) from October 2024.
- RTC in October 2025 attained 4,426 million lbs., up 55.9 million lbs. or 1.3 percent from October 2004.
- WOG yield in October 2025 was 75.7 percent, down from 75.8 percent in October 2024.
- The proportion marketed as chilled in October 2025 comprised 92.9 percent of RTC output compared to 93.3 percent in October 2024.
- Ante-mortem condemnation as a proportion of live weight attained 0.19 percent during October 2025 down from 0.17 percent in October 2024.
- Post-mortem condemnations as a proportion of processed mass corresponded to 0.41 percent during October 2025 compared to 0.44 percent in October 2024.
Comments
Mexico has recognized the OIE principle of regionalization after intensive negotiations between SENASICA and the U.S. counterpart, USDA-APHIS assisted by USAPEEC. Provided importing nations adhere to OIE guidelines on regionalization, localized outbreaks of avian influenza or possibly Newcastle disease will affect exports only from states or counties with outbreaks in commercial flocks. The response of China, Japan and some other nations is less predictable with bans placed on a nationwide or statewide basis. The response by China to outbreaks is influenced more by self-interest than considerations of scientific fact or international trade obligations. Other importing nations have confined restrictions to counties following the WOAH principle of regionalization. The challenge facing the U.S. as the second largest exporting nation after Brazil, will be to gain acceptance for controlled vaccination against HPAI in specific industry sectors and regions with appropriate surveillance and certification to the satisfaction of importing nations.
|
USDA-WASDE REPORT #667. January 12th 2026
|
01/12/2026 |
|
 OVERVIEW OVERVIEW
Understandably the January 12th edition of the World Agriculture Supply and Demand Estimates (WASDE) #667 projecting the 2026 season was extensively revised with respect to corn and soybeans from the previous post-shutdown December 9th edition reflecting the 2025 crop. Crop size and ending stocks were derived from previous harvest data, projections for domestic use and the effect of tariff policy and competition that influence export volumes
The January WASDE report projected that the 2026 corn crop will be harvested from an expanded 91.3 million acres, (90.0 million acres in 2025). The soybean crop will be harvested from an almost unchanged 80.4 million acres, (80.3 million acres in 2025).
The January WASDE yield value for the 2026 corn crop was raised 0.5 bushels to 186.5 bushels per acre. By comparison corn yield was 183.1 bushels per acre in 2024. Soybean yield was held at 53.0 bushels per acre, unchanged from 2025 reflecting previous harvests. By comparison soybean yield was 51.7 bushels per acre for the 2024 crop.
The January WASDE projection for the 2026 ending stock of corn was raised by 9.8 percent from December to 2,227 million bushels. The January USDA projection for the 2026 ending stock of soybeans was raised 20.7 percent from December to 350 million bushels consistent with domestic use and export projections.
The January WASDE raised the projected corn price for the 2026-2027 market year by 10 cents to an average of 410 cents per bushel. The projected average season price for soybeans was lowered by 30 cents to 1,020 cents per bushel. The price of soybean meal was lowered from the December WASDE by $5 to $295 per ton.
USDA commodity prices suggest stable feed costs for livestock and poultry producers given projections for yields, domestic use and exports. In some areas return from corn will be below break-even given relative yields, production costs and depressed per bushel prices. The USDA has announced an allocation of $12 billion to row-crop farmers to compensate for prolonged low commodity prices resulting from reduced exports occasioned by tariffs imposed by the U.S.
Projections for world output included in the January 2026 WASDE report, reflect the most recent estimates for the production and export of commodities especially in the Southern Hemisphere with an emphasis on volumes and prices offered by Argentine and Brazil. Economists also consider the impact of weather patterns arising from Southern Oscillation events especially on Brazil and Argentina.
It is accepted that USDA projections for exports will be influenced by the fluid situation relating to tariffs. Estimates of exports are also based on the perceived intentions and needs of China. This Nation sharply curtailed purchases of commodities and especially U.S. soybeans since the 2024-2025 market year and the current year to date.
CORN
 Production parameters for corn were updated from the December WASDE, reflecting the predicted yield, and updated projections for domestic use and trade. The January WASDE Report projected a 2026 crop of 17,021 million bushels, compared to 16,752 million bushels for the previous 2025 record harvest. The “Feed and Residual” category was raised 100 million bushels. (1.6 percent) for 2026 to 6,200 million bushels. The Food and Seed category was projected at 1,370 million bushels down 10 million bushels. The Ethanol and Byproducts Category was retained at 5,600 million bushels consistent with estimated demand for E-10 and higher blends for driving needs during winter months. Projected corn exports were held at 3,300 million bushels, based on recent orders and shipments. The anticipated ending stock of corn will be up 9.8 percent to 2,227 million bushels or 12 percent of projected availability. Production parameters for corn were updated from the December WASDE, reflecting the predicted yield, and updated projections for domestic use and trade. The January WASDE Report projected a 2026 crop of 17,021 million bushels, compared to 16,752 million bushels for the previous 2025 record harvest. The “Feed and Residual” category was raised 100 million bushels. (1.6 percent) for 2026 to 6,200 million bushels. The Food and Seed category was projected at 1,370 million bushels down 10 million bushels. The Ethanol and Byproducts Category was retained at 5,600 million bushels consistent with estimated demand for E-10 and higher blends for driving needs during winter months. Projected corn exports were held at 3,300 million bushels, based on recent orders and shipments. The anticipated ending stock of corn will be up 9.8 percent to 2,227 million bushels or 12 percent of projected availability.
The forecast USDA average season farm price for corn in the January WASDE report was 410 cents per bushel. At close of trading after the noon January 12th release of the WASDE, the CME spot price for corn was 421 cents per bushel, 2.7 percent above the USDA projection and 6.0 percent below the December 9th CME price.
JANUARY 2026 WASDE #667 Summary for the 2025 Corn Harvest:
|
Harvest Area
|
91.3 million acres
|
(98.8 m. acres planted, with harvest corresponding to 92.4% of acres planted)
|
|
Yield
|
186.5 bushels per acre
|
(Updated from 186.0 bushels per acre in the Dec. WASDE)
|
|
Beginning Stocks
|
1,551 m. bushels
|
|
|
Production
|
17,021 m. bushels
|
|
|
Imports
|
25 m. bushels
|
|
|
Total Supply
|
18,597 m. bushels
|
Proportion of Supply
|
|
Feed & Residual
|
6,200 m. bushels
|
33.3%
|
|
Food & Seed
|
1,370 m bushels
|
7.4%
|
|
Ethanol & Byproducts
|
5,600 m. bushels
|
30.1%
|
|
Domestic Use
|
13,170 m. bushels
|
70.8%
|
|
Exports
|
3,200 m. bushels
|
17.2%
|
|
Ending Stocks
|
2,227 m. bushels
|
12.0%
|
Average Farm Price: 410 cents per bushel. (Up 10 cents per bushel from the December WASDE)
SOYBEANS
Projections for soybeans were adjusted from the December WASDE to reflect the 2026 crop. Yield of 53.0 bushels per acre was retained but with a slightly higher area of 81.2 million acres planted compared to 2025. The January WASDE raised the projection of the 2026 soybean crop by 0.2 percent to 4,262 million bushels. Crush volume was raised 0.6 percent from December to 2,570 million bushels consistent with increased demand and industry capacity. Projected exports were reduced by 3.7 percent to 1,575 million bushels despite the prospect of increased imports by China following uncertainty over tariffs and diplomatic conflict. Ending stocks were anticipated to be 350 million bushels, up 20.7 percent from the December WASDE estimate. Prior to 2018, China, the largest trading partner for U.S. agricultural commodities, imported the equivalent of 25 percent of U.S. soybeans harvested.
The January USDA projection for the ex-farm seasonal price for soybeans was reduced 30 cents to 1,020 cents per bushel. At close of trading on January 12th following the noon release of the WASDE, the CME spot price was 1,050 cents per bushel, 2.9 percent above the January USDA projection and 3.5 percent below the December 9th CME price.
JANUARY 2026 WASDE #667 Summary for the 2026 Soybean Harvest:-
|
Harvest Area
|
80.4 million acres
|
81.2 m. acres planted. Harvest corresponding to 99.0% of planted acreage)
|
|
Yield
|
53.0 bushels per acre
|
(Updated from 53.5 bushels/acre in the September WASDE)
|
|
Beginning Stocks
|
325 m. bushels
|
|
|
Production
|
4,262 m. bushels
|
|
|
Imports
|
20 m. bushels
|
|
|
Total Supply
|
4,607 m. bushels
|
Proportion of Supply
|
|
Crush Volume
|
2,570 m. bushels
|
55.8%
|
|
Exports
|
1,575 m. bushels
|
34.2%
|
|
Seed
|
73 m. bushels
|
1.6%
|
|
Residual
|
39 m. bushels
|
0.8%
|
|
Total Use
|
4,257 m. bushels
|
92.4%
|
|
Ending Stocks
|
350 m. bushels
|
7.6%
|
Average Farm Price: 1,020 cents per bushel (Down 30 cents per bushel from the December WASDE)
SOYBEAN MEAL
 The projected parameters for soybean meal were updated from the December WASDE. Production will be up 0.9 percent to 60.8 million tons, consistent with the 0.6 percent increase in soybean crush volume of 2,570 million bushels. Projected production reflects the stagnant demand for biodiesel despite expanded U.S. crushing capacity. Crush volume is driven both by exports and domestic consumption for livestock feed and for soy oil supplying the food and biodiesel segments. The projection of domestic use was 42.0 million tons. Exports were estimated at 19.4 million tons. The projected parameters for soybean meal were updated from the December WASDE. Production will be up 0.9 percent to 60.8 million tons, consistent with the 0.6 percent increase in soybean crush volume of 2,570 million bushels. Projected production reflects the stagnant demand for biodiesel despite expanded U.S. crushing capacity. Crush volume is driven both by exports and domestic consumption for livestock feed and for soy oil supplying the food and biodiesel segments. The projection of domestic use was 42.0 million tons. Exports were estimated at 19.4 million tons.
The USDA projected the ex-plant price of soybean meal at $295 per ton, down $5 per ton from the January WASDE as an average for the season based on supply and demand considerations. USDA predicted an ending stock of 450,000 tons representing 0.7 percent of supply.
At close of trading on January 12th the CME spot price for soybean meal was $298 per ton, up $3 per ton (1.0 percent) compared to the USDA projection of $295 per ton and down 1.0 percent from the December 9th CME price.
JANUARY 2026 WASDE #667 Projection of Soybean Meal Production and Use
Quantities in thousand short tons
|
Beginning Stocks
|
398
|
|
Production
|
60,752
|
|
Imports
|
725
|
|
Total Supply
|
61,350
|
|
Domestic Use
|
42,025
|
|
Exports
|
19,400
|
|
Total Use
|
61,425
|
|
Ending Stocks
|
450
|
Average Price ex plant: $295 per ton (Down $5 per ton from the December WASDE)
IMPLICATIONS FOR PRODUCTION COST
 The price projections based on CME quotations for corn and soybeans suggest higher feed production costs for broilers and eggs. Going forward, prices of commodities will be determined by World supply and demand and U.S. domestic use and exports. The price projections based on CME quotations for corn and soybeans suggest higher feed production costs for broilers and eggs. Going forward, prices of commodities will be determined by World supply and demand and U.S. domestic use and exports.
For each 10 cents per bushel change in corn:-
- The cost of egg production would change by 0.45 cent per dozen
- The cost of broiler production would change by 0.25 cent per live pound
For each $10 per ton change in the cost of soybean meal:-
- The cost of egg production would change by 0.35 cent per doze
- The cost of broiler production would change by 0.30 cent per live pound.
WORLD SITUATION
With respect to world coarse grains and oilseeds the January 2026 WASDE Report included the following appraisals by USDA:-
COARSE GRAINS:
“Global coarse grain production for 2025/26 is forecast up 14.8 million tons to 1.591 billion.
This month’s foreign coarse grain outlook is for greater production, virtually unchanged trade, and higher ending stocks. Foreign corn production is forecast higher with an increase Global coarse grain production for 2025/26 is forecast up 14.8 million tons to 1.591 billion.
This month’s foreign coarse grain outlook is for greater production, virtually unchanged trade, and higher ending stocks. Foreign corn production is forecast higher with an increase for China, where production is raised to a record 301.2 million tons based on the latest data from the National Bureau of Statistics. Foreign corn ending stocks for 2025/26 are higher, mostly reflecting an increase for China. Global corn stocks, at 290.9 million tons, are raised 11.8 million.”
OILSEEDS:
 “Foreign 2025/26 oilseed production is raised 2.4 million tons mainly on higher soybean production partly offset by lower cottonseed and rapeseed output. For sunflowerseed, higher production for Argentina is offset by lower production for Russia. Rapeseed production is also lowered for Russia”. “Foreign 2025/26 oilseed production is raised 2.4 million tons mainly on higher soybean production partly offset by lower cottonseed and rapeseed output. For sunflowerseed, higher production for Argentina is offset by lower production for Russia. Rapeseed production is also lowered for Russia”.
“The 2025/26 global soybean outlook includes higher production, increased crush, lower exports, and higher ending stocks. Global soybean production is increased 3.1 million tons to 425.7 million, reflecting higher crops for Brazil and the United States but lower output for China. Brazil soybean production is raised 3.0 million tons to 178.0 million on beneficial weather conditions in the Center West during the peak of the growing season. Further, positive early-season conditions and consistent rainfall in the south of Brazil also bolsters yield prospects, especially compared to previous years when the region faced drought. Soybean crush and soybean meal exports are raised for Brazil and the United States, and pairs with higher soybean meal imports for the European Union. EU soybean crush and soybean imports are lowered on higher imported soybean meal supplies. Global soybean exports for 2025/26 are reduced 0.1 million tons to 187.6 million as higher exports for Brazil are offset by lower U.S. shipments. Global ending stocks are increased 2.0 million tons to 124.4 million, mainly on higher stocks for the United States and Brazil.”
World and U.S. Data Combined for Coarse Grains and Oilseeds:-
|
Factor: Million m. tons
|
Coarse Grains
|
Oilseeds
|
|
Output
|
1,591*
|
693
|
|
Supply
|
1,914
|
835
|
|
World Trade
|
250
|
215
|
|
Use
|
1,592
|
579
|
|
Ending Stocks
|
322
|
145
|
*Values rounded to one million metric ton
(1 metric ton corn= 39.37 bushels. 1 metric ton of soybeans = 36.74 bushels)
(“ton” represents 2,000 pounds)
|
Monthly Broiler Production Statistics, August-September 2024
|
09/28/2025 |
|
Broiler Chick Placements August-September-July 2025.

According to the September 24th 2025 USDA Broiler Hatchery Report, 1.239 million eggs were set over five weeks extending from August 23rd 2025 through September 20th 2025 inclusive. This was three percent higher compared to the corresponding period in 2024.
Total chick placements for the U.S. over the five-week period amounted to 971.0 million chicks. Claimed hatchability for the period averaged 79.7 percent for eggs set three weeks earlier. Each 1.0 percent change in hatchability represents approximately 1.94 million chicks placed per week and 1.84 million broilers processed, assuming five percent culls and mortality and within the current range of weekly settings.
Cumulative chick placements for the period January 7th through December 30th 2024 amounted to 9.67 billion chicks. For January 4th through September 20th 2025 chick placements attained 7.32 billion, up one percent from the corresponding week in 2024.
According to the September 22nd 2025 edition of USDA Chickens and Eggs, pullet breeder chicks hatched and intended for U.S. placement during August 2025 amounted to 8.24 million, down 5.3 percent (0.46 million pullet chicks) from August 2024 and 0.7 percent (61,000 pullet chicks) less than the previous month of July 2025. Broiler breeder hen complement attained 59.94 million on September 1st 2025, 2.5 percent (1.56 million hens) down from September 1st 2024 and 0.3 percent (180,000 hens) lower than August 1st 2025.
Broiler Production September 2025
As documented in the September 25th 2025 USDA Weekly Poultry Slaughter Reports for the processing week ending September 20th 2025, 175.0 million broilers were processed at 6.70 lbs. live. This was 2.5 percent more than the 170.8 million processed during the corresponding week in September 2024. Broilers processed in 2025 to date amounted to 6,242 million, 2.1 percent more than for the corresponding period in 2024.
Ready to cook (RTC) weight for the most recent week in September was 903.0 million lbs. (410,462 metric tons). This was 3.8 percent more than the 870.0 million lbs. during the corresponding week in September 2024. Dressing percentage was a nominal 76.0 percent. For 2025 to date RTC broiler production attained 31,704 million lbs. (15.078 million metric tons). This quantity was 3.5 percent more than for the corresponding period in 2024.
The USDA posted live-weight data for the past week ending September 20th and YTD 2025 including:-
|
Live Weight Range (lbs.)
|
<4.25
|
4.26-6.25
|
6.26-7.25
|
>7.76
|
|
Proportion past week (%)
|
14
|
28
|
28
|
30
|
|
Change from 2020 YTD (%)
|
-8
|
+2
|
0
|
+11
|
September 2025 Frozen Inventory
According to the September 25th 2025 USDA Cold Storage Report, issued monthly, stocks of broiler products as of August 31st 2025 compared to August 31st 2024 showed differences with respect to the following categories:-
- Total Chicken category attained 790.9 million lbs. (359.5 thousand metric tons) corresponding to approximately one week of production based on recent weekly RTC output. The August 2025 inventory was up 4.3 percent compared to 758,551 million lbs. (344.8 thousand metric tons) on August 31st 2024 and up 1.9 percent from the previous month of July 2025.
- Leg Quarters were down 9.0 percent to 56.9 million lbs. compared to August 31st 2024 consistent with the data on exports. Inventory was up 2.0 percent from July 31st 2025. Given the trend in inventory of leg quarters it is evident that this category continues to be shipped in varying quantities as the principal (96 percent) chicken export product to a number of nations with the top five importers representing 51.1 percent of the January-July 2025 export total of 1,768,136 metric tons of chicken parts. The top ten importing nations represented 66.5 percent of broiler exports with Mexico was the leading importer followed by Cuba Taiwan, the Philippines, and Canada.
- The Breasts and Breast Meat category was up 17.1 percent from August 31st 2024 to 240.5 million lbs. indicating a relatively lower domestic consumer demand for this category despite concern over inflation in the cost of alternative proteins. August 31st 2025 stock was 1.1 percent lower than on July 31st 2025. The trend through the first eight months of 2025 suggests stable but low retail and food service demand for the white meat category. This is despite promotion of chicken sandwiches and wraps by QSRs in the face of a higher cost for beef coupled with an increasing pattern of eat-at-home consumption.
- Total inventory of dark meat (drumsticks legs, thighs and thigh quarters but excluding leg quarters) on August 31st 2025 decreased 2.9 percent from August 31st 2024 to 60.9 million lbs. This difference suggests an increase in domestic demand for lower-priced dark meat against the prevailing price of white chicken meat. Higher prices for competitive proteins offer an opportunity to increase domestic demand for this category with innovative product development and promotion.
- Wings showed a 7.2 percent decrease from August 2024, contributing to a stock of 55.4 million lbs. Inventory of wings was 5.7 percent higher compared to July 2025. Movement in stock over the past 12 months has demonstrated lower demand for this category due in part from competitive “boneless wings.” Increased consumption traditionally associated with significant sports events including the College and Super Bowls reduced the volumes of storage in January and February 2025. The progressive increase in unit price during 2024 plateaued in 2025 due to consumer fatigue and competition from competing protein snacks despite continued interest in professional and collegiate football.
- The inventory of Paws and Feet was 4.7 percent higher than on August 31st 2024 to 29.9 million lbs. Stock was was 9.6 percent higher than on July 31st 2025. Prior to the April 2020 Phase-1 Trade Agreement approximately half of the shipments of paws and feet destined for Hong Kong were landed and transshipped to the Mainland, a trend that is re-emerging.
- The Other category comprising 330.0 million lbs. on August 31st 2025 was down 1.0 percent from August 2024 but represented a substantial 41.7 percent of inventory. The high proportion of the Other category suggests further classification or re-allocation by USDA to the designated major categories.
August 2025 Processed Broiler Production
The USDA Poultry Slaughter Report released on September 25th 2025 covered August 2025 comprising 21 working days, one less than August 2024. The following values were documented for the month:-
- A total of 797.2 million broilers were processed in August 2025, down 17.1 million or 2.1 percent from August 2024;
- Total live weight in August 2025 was 5,304 million lbs., down 38.7 million lbs. or 0.7 percent from August 2024;
- Unit live weight in August 2025 was 6.65 lbs., up 0.09lb. (1.4 percent) from August 2024.
- RTC in August 2025 attained 4,021 million lbs., down 17.8 million lbs. or 0.4 percent from August 2004.
- WOG yield in August 2025 was 75.8 percent, up from 75.6 percent in August 2024.
- The proportion marketed as chilled in August 2025 comprised 93.4 percent of RTC output compared to 93.6 percent in August 2024.
- Ante-mortem condemnation as a proportion of live weight attained 0.19 percent during August 2025 unchanged from 0.19 percent in August 2024.
- Post-mortem condemnations as a proportion of processed mass corresponded to 0.43 percent during August 2025 compared to 0.44 percent in August 2024.

Comments
Mexico has recognized the OIE principle of regionalization after intensive negotiations between SENASICA and the U.S. counterpart, USDA-APHIS assisted by USAPEEC. Provided importing nations adhere to OIE guidelines on regionalization, localized outbreaks of avian influenza or possibly Newcastle disease will affect exports only from states or counties with outbreaks in commercial flocks. The response of China, Japan and some other nations is less predictable with bans placed on a nationwide or statewide basis. The response by China to outbreaks is influenced more by self-interest than considerations of scientific fact or international trade obligations. Other importing nations have confined restrictions to counties following the WOAH principle of regionalization. The challenge facing the U.S. as the second largest exporting nation after Brazil, will be to gain acceptance for controlled vaccination against HPAI in specific industry sectors and regions with appropriate surveillance and certification to the satisfaction of importing nations.
|
U.S Broiler Chick Production-By the Numbers
|
09/25/2025 |
|
 The following production data reflecting calendar month was summarized from the September 23rd 2025 edition of the USDA Chickens and Eggs-: The following production data reflecting calendar month was summarized from the September 23rd 2025 edition of the USDA Chickens and Eggs-:
- August 2025 broiler hatching egg production was 1,186 million, down 2.5 percent from August 2024.
- August 2025 broiler hatch was 878.6 million, up 0.4 percent from August 2024.
- January to August 2025 cumulative broiler hatch was 6,853 million, up 0.6 percent compared to the first eight months of 2025.
- September 1st 2025 broiler hatching eggs in incubators attained 748.5 million, up 1.0 percent from September 1st 2024.
- August 2025 U.S. Broiler parent pullets placed amounted to 8.2 million, down 5.3 percent from August 2024.
- September 1st 2025 broiler parent hen population was 59.9 million, down 2.5 percent from September 1st 2024.
  The take-away from the September report is a transitory reduction in the national breeder flock consistent with improved hatch. The U.S. Industry responds to prevailing domestic and export demand by selecting appropriate capacity in relation to price for a broad range of products The take-away from the September report is a transitory reduction in the national breeder flock consistent with improved hatch. The U.S. Industry responds to prevailing domestic and export demand by selecting appropriate capacity in relation to price for a broad range of products
|
Broiler Month
|
08/19/2025 |
|
Broiler Chick Placements June-July 2025.
According to the July 30th 2025 USDA Broiler Hatchery Report, 1.257 million eggs were set over five weeks extending from June 28th 2025 through July 26th 2025 inclusive. This was 1.0 percent higher compared to the corresponding period in 2024.
Total chick placements for the U.S. over the five-week period amounted to 972.9 million chicks. Claimed hatchability for the period averaged 79.3 percent for eggs set three weeks earlier. Each 1.0 percent change in hatchability represents approximately 1.94 million chicks placed per week and 1.84 million broilers processed, assuming five percent culls and mortality and within the current range of weekly settings.
Cumulative chick placements for the period January 7th through December 30th 2024 amounted to 9.67 billion chicks. For January 4th through July 28th 2025 chick placements attained 5.00 billion, up one percent from the corresponding week in 2023.
According to the July 21st 2025 edition of the USDA Chickens and Eggs, pullet breeder chicks hatched and intended for U.S. placement during June 2025 amounted to 9.38 million, down 3.9 percent (0.39 million pullet chicks) from June 2024 and 16.5 percent (1.38 million pullet chicks) more than the previous month of May 2025. Broiler breeder hen complement attained 60.37 million on July1st 2025, 2.4 percent (1.46 million hens) more than on July 1st 2024.
Broiler Production July 2025
As documented in the July 31st 2025 USDA Weekly Poultry Slaughter Reports for the processing week ending July 26th 2025, 170.1 million broilers were processed at 6.53 lbs. live. This was 1.8 percent more than the 167.1 million processed during the corresponding week in July 2024. Broilers processed in 2025 to date amounted to 4,966 million, 1.9 percent more than for the corresponding period in 2024.
Ready to cook (RTC) weight for the most recent week in July was 827.2 million lbs. (376,005 metric tons). This was 0.3 percent less than the 829.3 million lbs. during the corresponding week in July 2024. Dressing percentage was a nominal 76.0 percent. For 2025 to date RTC broiler production attained 24,755 million lbs. (11.25 million metric tons). This quantity was 3.3 percent more than for the corresponding period in 2024.
The USDA posted live-weight data for the past week ending July 26th and YTD 2025 including:-
|
Live Weight Range (lbs.)
|
<4.25
|
4.26-6.25
|
6.26-7.25
|
>7.76
|
|
Proportion past week (%)
|
17
|
28
|
30
|
35
|
|
Change from 2020 YTD (%)
|
-7
|
+2
|
-1
|
+10
|
June 2025 Frozen Inventory
According to the July 25th 2025 USDA Cold Storage Report, issued monthly, stocks of broiler products as of June 30th 2025 compared to June 30th 2024 showed differences with respect to the following categories:-
- Total Chicken category attained 764.8 million lbs. (347.6 thousand metric tons) corresponding to approximately one week of production based on recent weekly RTC output. The June 2025 inventory was up 2.5 percent compared to 745,779 million lbs. (339.0 thousand metric tons) on June 30th 2024 and up 1.5 percent from the previous month of May 2025.
- Leg Quarters were up by 0.6 percent to 55.0 million lbs. compared to June 2024 consistent with the data on exports. Inventory was up 2.5 percent from May 2025. Given the trend in inventory of leg quarters it is evident that this category continues to be shipped in varying quantities as the principal (96 percent) chicken export product to a number of nations with the top five importers representing 48.6 percent of the January-May 2025 export total of 1,259,559 metric tons of chicken parts. Mexico was the leading importer with 23.3 percent followed by Cuba (7.9%); Taiwan, (6.6%); Philippines, (6.3%) and Canada, (5.8%)
- The Breasts and Breast Meat category was up 10.1 percent from June 2024 to 227.1 million lbs. indicating a relatively lower domestic consumer demand for this category despite concern over inflation in the cost of alternative proteins. June 30th 2025 stock was 2.1 percent higher than on May 31st 2025. The trend through the first five months of 2025 suggests stable but low retail and food service demand for the white meat category. This is despite promotion of chicken sandwiches and wraps by QSRs in the face of a higher cost for beef and an increasing pattern of eat-at-home consumption.
- Total inventory of dark meat (drumsticks legs, thighs and thigh quarters but excluding leg quarters) on June 30th 2025 decreased 2.3 percent from June 2024 to 63.7 million lbs. This difference suggests an increase in domestic demand for lower-priced dark meat against the prevailing price of white chicken meat. Higher prices for competitive proteins offer an opportunity to increase domestic demand for this category with innovative product development and promotion.
- Wings showed a 5.0 percent decrease from June 2024, contributing to a stock of 52.5 million lbs. Inventory of wings was 7.7 percent lower compared to May 2025. Movement in stock over the past 12 months has demonstrated lower demand for this category due in part from competitive “boneless wings.” Increased consumption traditionally associated with significant sports events including the College and Super Bowls reduced the volumes of storage in January and February 2025. The progressive increase in unit price during 2024 plateaued in 2025 due to consumer fatigue and competition from competing protein snacks despite continued interest in professional and collegiate football.
- The inventory of Paws and Feet was 4.2 percent higher than on June 30th 2024 to 31.9 million lbs. Stock was was 2.2 percent higher than on May 31st 2025. Prior to the April 2020 Phase-1 Trade Agreement approximately half of the shipments of paws and feet destined for Hong Kong were landed and transshipped to the Mainland, a trend that is re-emerging.
- The Other category comprising 321.8 million lbs. on June 30th 2025 was down 0.6 percent from June 2024 but represented a substantial 42.1 percent of inventory. The high proportion of the Other category suggests further classification or re-allocation by USDA to the designated major categories.
June 2025 Processed Broiler Production
The USDA Poultry Slaughter Report released on July 25th 2025 covered June 2025 comprising 20 working days, one less than June 2024. The following values were documented for the month:-
- A total of 787.3 million broilers were processed in June 2025, up 34.1 million or 4.5 percent from June 2024;
- Total live weight in June 2025 was 5,190 million lbs., up 255.8 million lbs. or 5.2 percent from June 2024;
- Unit live weight in June 2025 was 6.59 lbs., up 0.04lb. (0.6 percent) from June 2024.
- RTC in June 2025 attained 3,926 million lbs., up 5.3 million lbs. or 5.4 percent from June 2004.
- WOG yield in June 2025 was 75.6 percent, up from 75.5 percent in June 2024.
- The proportion marketed as chilled in June 2025 comprised 93.6 percent of RTC output compared to 93.4 percent in June 2024.
- Ante-mortem condemnation as a proportion of live weight attained 0.20 percent during June 2025 compared to 0.19 percent in June 2024.
- Post-mortem condemnations as a proportion of processed mass corresponded to 0.43 percent during June 2025 compared to 0.47 percent in June 2024.
-

Comments
Mexico has recognized the OIE principle of regionalization after intensive negotiations between SENASICA and the U.S. counterpart, USDA-APHIS assisted by USAPEEC. Provided importing nations adhere to OIE guidelines on regionalization, localized outbreaks of avian influenza or possibly Newcastle disease will affect exports only from states or counties with outbreaks in commercial flocks. The response of China, Japan and some other nations is less predictable with bans placed on a nationwide or statewide basis. The response by China to outbreaks is influenced more by self-interest than considerations of scientific fact or international trade obligations. Other importing nations have confined restrictions to counties following the WOAH principle of regionalization. The challenge facing the U.S. as the second largest exporting nation will be to gain acceptance for controlled vaccination against HPAI in specific industry sectors and regions with appropriate surveillance and certification to the satisfaction of importing nations.
|
U.S Broiler Chick Production-By the Numbers
|
08/19/2025 |
|
 The following production data reflecting the past calendar month was summarized from the July 21st 2025 edition of the USDA Chickens and Eggs-: The following production data reflecting the past calendar month was summarized from the July 21st 2025 edition of the USDA Chickens and Eggs-:
June 2025 broiler hatching egg production was 1,149 million, down 1.0 percent from June 2024.
June 2025 broiler hatch was 856.3 million, up 1.4 percent from June 2024.
January to June 2025 cumulative broiler hatch was 5,094 million, up 0.5 percent from first half of 2025
 July 1st 2025 broiler hatching eggs in incubators, 754.3 million, up 1.4 percent from July 1st 2024 July 1st 2025 broiler hatching eggs in incubators, 754.3 million, up 1.4 percent from July 1st 2024
June 2025 U.S. Broiler parent pullets placed, 9.4 million, down <0.1 percent from June 2024
July 1st 2025 broiler parent hen population 60.4 million, down 2.4 percent from July 2024.
The take-away from July data is stability of the national breeder flock. This is consistent with prevailing demand, capacity and prices
|
Updated USDA-ERS Poultry Meat Projection for August
|
08/17/2025 |
|
On August 18th 2025 the USDA-Economic Research Service released updated production and consumption data with respect to broilers and turkeys, covering 2024, a projection for 2025 and a forecast for 2026.
The revised 2025 projection for broiler production is for 47,762 million lbs. (21.710 million metric tons) up 1.6 percent from 2024. USDA projected per capita consumption of 102.7 lbs. (46.7 kg.) for 2025, up 1.6 percent from 2024. Exports will attain 6,481 million lbs. (2.946 million metric tons), 3.0 percent below the previous year.
The 2026 USDA forecast for broiler production will be 48,150 million lbs. (21.886 million metric tons) up 0.8 percent from 2025 with per capita consumption up 0.1 lb. to 102.8 lbs. (46.7 kg). Exports will be 2.0 percent higher compared to 2025 at 6,610 million lbs. (3.005 million metric tons), equivalent to 13.7 percent of production.
Production values for the broiler and turkey segments of the U.S. poultry meat industry are tabulated below:-
|
Parameter
|
2024
(actual)
|
2025
(projection)
|
2026
(forecast)
|
Difference
2024 to 2025
|
|
Broilers
|
|
|
|
|
|
Production (million lbs.)
|
46,994
|
47,762
|
48,150
|
+1.6
|
|
Consumption (lbs. per capita)
|
101.1
|
102.7
|
102.8
|
+1.5
|
|
Exports (million lbs.)
|
6,680
|
6,481
|
6,610
|
-3.0
|
|
Proportion of production (%)
|
14.2
|
13.6
|
13.7
|
-4.2
|
|
|
|
|
|
|
|
Turkeys
|
|
|
|
|
|
Production (million lbs.)
|
5,121
|
4,791
|
5,121
|
-6.4
|
|
Consumption (lbs. per capita)
|
13.8
|
13.0
|
13.6
|
-5.8
|
|
Exports (million lbs.)
|
486
|
412
|
436
|
-15.2
|
|
Proportion of production (%)
|
9.5
|
8.6
|
8.5
|
-9.5
|
Source: Livestock, Dairy and Poultry Outlook released August 18th 2025
The August USDA report updated projection for the turkey industry for 2025 including annual production of 4,791 million lbs. (2.173 million metric tons), down 6.4 percent from 2024. Consumption in 2025 is projected to be 13.0 lbs. (5.9 kg.) per capita, down by 5.8 percent from the previous year. Export volume will attain 412 million lbs. (187,272 metric tons) in 2025. Values for production and consumption of RTC turkey in 2025 are considered to be realistic, given year to date data, the prevailing economy, variable weekly poult placements, production levels, losses from HPAI and inventories consistent with season.
The 2026 forecast for turkey production is 5,121 million lbs. (2.328 million metric tons) up an optimistic 6.9 percent from 2025 with per capita consumption up 4.6 percent to 13.6 lbs. (6.2 kg). Exports will be 5.8 percent higher than in 2025 to 435 million lbs. (197,728 metric tons) equivalent to 8.5 percent of production.
Export projections do not allow for a breakdown in trade relations with existing major partners including Mexico, Canada and China nor the impact of catastrophic diseases including HPAI and vvND in either the U.S. or importing nations
|
USDA-WASDE REPORT #663, August 11th 2025
|
08/12/2025 |
|
OVERVIEW
The USDA provided updated projections for the production of corn and soybeans in the August12thWorld Agriculture Supply and Demand Estimates (WASDE) #663, reflecting the 2025 crop. Production values for corn and soybeans were updated from previous editions. Projections of crop size and ending stocks are derived from acreage planted, recent annual crop yields, the latest crop progress reports, data relating to domestic use and tariff policy and competition that influence exports.
The August WASDE report confirmed that the 2025 corn crop will be harvested from an expanded 88.7 million acres, (82.7 million acres in 2024). The soybean crop will be harvested from a reduced 80.1 million acres, (86.3 million acres in 2024).
The August WASDE yield value for the 2025 corn crop was predicted at 188.8 bushels per acre up 4.3 percent from July. By comparison yield was 183.1 bushels per acre in 2024. The projected value for soybean yield was an optimistic 53.6 bushels per acre up 2.1 percent from July. By comparison yield was 51.7 bushels per acre for the previous 2024 crop.
The August WASDE projection for the ending stock of corn was increased 27.5 percent from July to 2,117 million bushels. The August USDA projection for the ending stock of soybeans was down 6.5 percent from July to 290 million bushels due to reduced supply and lower exports.
The August WASDE projected the corn price for the 2025-2026 market year at an average of 390 cents per bushel. The projected average season price for soybeans was unchanged at 1,010 cents per bushel. The price of soybean meal was lowered 3.4 percent to $280 per ton. USDA commodity prices suggest stable to lower feed costs for livestock and poultry producers. Row crop farmers and especially corn growers will experience declining margins. In some areas corn will be below break-even given relative production costs and per bushel prices. It is probable that high support prices will be required if importing nations respond negatively to tariffs proposed by the Administration.
Projections for world output included in the August 2025 WASDE report, reflect the most recent estimates for the production and export of commodities especially in the Southern Hemisphere with an emphasis on Argentine and Brazil. Economists also considered the impacts of weather patterns arising from the La Nina event especially on South America.
It is accepted that USDA projections for export will be influenced by the fluid situation relating to tariffs. Exports are also based on the perceived intentions and needs of China. This Nation has sharply curtailed purchases of commodities and especially U.S. soybeans during the previous and current market year.
CORN
Production parameters for corn were updated from the July WASDE, influenced by data on crop progress and acreage planted. The August WASDE Report projected a 2025 crop of 16,742 million bushels, compared to 15,413 million bushels for the previous 2024 record harvest. As of August 10th, 94 and 14 percent of the crop had attained the stages of silking and dent respectively. The “Feed and Residual” category was raised 4.3 percent from July to 6,100 million bushels. The Food and Seed category was projected at 1,380 million bushels. The Ethanol and Byproducts Category was raised 1.8 percent to 5,600 million bushels consistent with estimated demand for E-10 and higher blends for driving needs. Projected corn exports were raised 7.5 percent to 2,875 million bushels, based on recent orders and shipments. The anticipated ending stock of corn will be 2,117 million bushels or 11.8 percent of projected availability.
The forecast USDA average season farm price for corn in the August WASDE report was 390 cents per bushel. At 16H00 EDT on August 12th after the noon release of the WASDE, the CME spot price for corn was 394 cents per bushel, 1.0 percent above the USDA projection but down 7.1 percent from July 12th CME price.
AUGUST 2025 WASDE #663 Projections for the 2025 Corn Harvest:
|
Harvest Area
|
88.7 m acres
|
(97.3 m. acres planted, with harvest corresponding to 91.2% of acres planted)
|
|
Yield
|
188.8 bushels per acre
|
(Updated from 181.0 bushels per acre in the July WASDE)
|
|
Beginning Stocks
|
1,305 m. bushels
|
|
|
Production
|
16,742 m. bushels
|
|
|
Imports
|
25 m. bushels
|
|
|
Total Supply
|
18,072 m. bushels
|
Proportion of Supply
|
|
Feed & Residual
|
6,100 m. bushels
|
33.7%
|
|
Food & Seed
|
1,380 m bushels
|
7.6%
|
|
Ethanol & Byproducts
|
5,600 m. bushels
|
31.0%
|
|
Domestic Use
|
13,080 m. bushels
|
72.3%
|
|
Exports
|
2,875 m. bushels
|
15.9%
|
|
Ending Stocks
|
2,117 m. bushels
|
11.8%
|
Average Farm Price: 390 cents per bushel.
SOYBEANS
Production parameters for corn were updated from the July WASDE, influenced by crop progress data and acreage planted. The August WASDE Report projected a 2025 yield of 53.6 bushels per acre but with reduced acreage planted compared to 2024. The August WASDE projected the soybean crop to be 4,292 million bushels. As of August 10th, 71 percent of the crop was setting pods. Crush volume was unchanged from July at 2,540 million bushels despite recently increased industry capacity. Projected exports were reduced 6.0 percent to 1,705 million bushels based on the prospect of reduced imports by China following uncertainty over tariffs and diplomatic conflict. Ending stocks were anticipated to be 290 million bushels, down 6.5 percent from the July WASDE. Prior to 2018, China, the largest trading partner for U.S. agricultural commodities, imported the equivalent of 25 percent of U.S. soybeans harvested.
The USDA WASDE August projection for the ex-farm price for soybeans was unchanged from July at 1,010 cents per bushel. At 16H00 EDT on August 12th following release of the WASDE, the CME spot price was 1,032 cents per bushel, 2.2 percent above the August USDA projection and 2.5 percent above the July 12th CME price.
AUGUST 2025 WASDE #663 Projection for the 2025 Soybean Harvest:-
|
Harvest Area
|
80.1 m acres
|
80.9 m. acres planted. Harvest corresponding to 99.0% of planted acreage)
|
|
Yield
|
53.6 bushels per acre
|
(Updated from 52.5 bushel/acre in the July WASDE)
|
|
Beginning Stocks
|
350 m. bushels
|
|
|
Production
|
4,292 m. bushels
|
|
|
Imports
|
20 m. bushels
|
|
|
Total Supply
|
4,642 m. bushels
|
Proportion of Supply
|
|
Crush Volume
|
2,540 m. bushels
|
54.7%
|
|
Exports
|
1,705 m. bushels
|
36.7%
|
|
Seed
|
73 m. bushels
|
1.6%
|
|
Residual
|
34 m. bushels
|
0.8%
|
|
Total Use
|
4,352 m. bushels
|
93.8%
|
|
Ending Stocks
|
290 m. bushels
|
6.2%
|
Average Farm Price: 1,010 cents per bushel
SOYBEAN MEAL
The projected parameters for soybean meal were retained from July. Production will attain 59.9 million tons, consistent with the unchanged soybean crush volume of 2,540 million bushels. Projected production reflects the stagnant demand for biodiesel despite expanded U.S. crushing capacity. Crush volume is driven both by exports and domestic consumption for livestock feed and for soy oil supplying the food and biodiesel segments. The projection of domestic use was 41,775 million tons. Exports were estimated at 18.7 million tons.
The USDA projected the ex-plant price of soybean meal at $310 is unchanged since the February WASDE as an average for the season based on supply and demand considerations. USDA predicted an ending stock of 475,000 tons representing 0.8 percent of supply.
At 16H00 EDT on August 12th the CME spot price for soybean meal was $292 per ton, up 4.3 percent compared to the August WASDE projection of $280 per ton and up 2.8 percent from the July CME price.
AUGUST 2025 WASDE #663 Projection of Soybean Meal Production and Use
|
Beginning Stocks
|
450
|
|
Production
|
59,850
|
|
Imports
|
650
|
|
Total Supply
|
60,950
|
|
Domestic Use
|
41,775
|
|
Exports
|
18,700
|
|
Total Use
|
60,475
|
|
Ending Stocks
|
475
|
(Quantities in thousand short tons)
Average Price ex plant:$280 per ton
I
MPLICATIONS FOR PRODUCTION COST
The price projections based on CME quotations for corn and soybeans suggest lower feed production costs for broilers and eggs. Going forward, prices of commodities will be determined by World supply and demand and U.S. domestic yield, use and exports.
For each 10 cents per bushel change in corn:-
- The cost of egg production would change by 0.45 cent per dozen
- The cost of broiler production would change by 0.25 cent per live pound
For each $10 per ton change in the cost of soybean meal:-
- The cost of egg production would change by 0.35 cent per doze
- The cost of broiler production would change by 0.30 cent per live pound.
WORLD SITUATION
With respect to world coarse grains and oilseeds the August 2025 WASDE Report included the following appraisals by USDA:-
COARSE GRAINS:
“Global coarse grain production for 2025/26 is forecast 24.9 million tons higher to 1.572 billion.
This month’s 2025/26 foreign coarse grain outlook is for lower production, trade, and ending
stocks relative to last month. Foreign corn production is down reflecting cuts to the EU and
Serbia that are partially offset by increases for Ukraine and Canada. For the EU and Serbia
extreme heat and dryness in southeastern Europe during the month of July reduces yield
prospects. Area is also lowered for the EU. Ukraine production is raised on greater area. Canada
is higher reflecting an increase in yield expectations. Foreign barley production for 2025/26 is
reduced with a decline for Uruguay”.
“Major global coarse grain trade changes for 2025/26 include higher corn exports for the United
States and Ukraine but reductions for Serbia and the EU. Corn imports are raised for Mexico, the
EU, Egypt, Colombia, and Turkey but lowered for Canada. Foreign corn ending stocks are down,
reflecting declines for China, Indonesia, and the EU that are partly offset by increases for
Ukraine and Egypt. Global corn stocks, at 282.6 million tons, are up 10.4 million”.
OILSEEDS:
“Global 2025/26 oilseed production is lowered 3.3 million tons to 690.1 million mainly on lower
soybean, sunflower seed, and cottonseed production. Global sunflower seed production is
lowered 1.2 million tons to 55.1 million on hot and dry weather conditions leading to lower yields for the EU, Ukraine, Turkey, and Serbia”.
“Global soybean supply and demand forecasts for 2025/26 include lower production, exports, and ending stocks. Global production for 2025/26 is lowered mainly on lower production for the
United States and Serbia. Exports are reduced for the United States but raised for Argentina and
Uruguay. Imports are reduced for the EU, Iran, and Vietnam. Global ending stocks are reduced
1.2 million tons to 124.9 million on lower stocks for Argentina, the EU, Iran, Vietnam, and the
United States.”
World and U.S. Data Combined for Coarse Grains and Oilseeds:-
|
Factor: Million m. tons
|
Coarse Grains
|
Oilseeds
|
|
Output
|
1,572*
|
690
|
|
Supply
|
1,884
|
834
|
|
World Trade
|
243
|
214
|
|
Use
|
1,574
|
581
|
|
Ending Stocks
|
310
|
144
|
*Values rounded to one million metric ton
(1 metric ton corn= 39.37 bushels. 1 metric ton of soybeans = 36.74 bushels)
(“ton” represents 2,000 pounds)
|
Broiler Month
|
06/26/2025 |
|
Monthly Broiler Production Statistics, May 2024.
Broiler Chick Placements May-June 2025.
According to the June 18th 2025 USDA Broiler Hatchery Report, 1.260 million eggs were set over five weeks extending from May 17th 2025 through June14th 2025 inclusive. This was 1.2 percent higher compared to the corresponding period in 2024.
Total chick placements for the U.S. over the five-week period amounted to 967.67 million chicks. Claimed hatchability for the period averaged 79.1 percent for eggs set three weeks earlier. Each 1.0 percent change in hatchability represents approximately 1.92 million chicks placed per week and 1.82 million broilers processed, assuming five percent culls and mortality and within the current range of weekly settings.
Cumulative chick placements for the period January 7th through December 30th 2024 amounted to 9.67 billion chicks. For January 4th through June 14th 2025 chick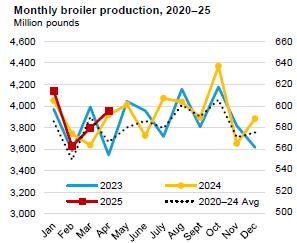 placements attained 4.61 billion, up one percent from the corresponding week in 2023. placements attained 4.61 billion, up one percent from the corresponding week in 2023.
According to the June 23rd 2025 edition of the USDA Chickens and Eggs, pullet breeder chicks hatched and intended for U.S. placement during May 2025 amounted to 8.17 million, down 0.7 percent (58,000 pullet chicks) from May 2024 and 7.9 percent (699,000 pullet chicks) less than the previous month of April 2025. Broiler breeder hen complement attained 60.30 million on May1st 2025, 2.0 percent (1.23 million hens) less than on May 1st 2024.
Broiler Production May 2025
As documented in the June 19th 2025 USDA Weekly Poultry Slaughter Reports for the processing week ending June 14th 2025, 170.9 million broilers were processed at 6.50 lbs. live. This was 3.6 percent more than the 165.0 million processed during the corresponding week in June 2024. Broilers processed in 2025 to date amounted to 3,963 million, 1.9 percent more than for the corresponding period in 2024.
Ready to cook (RTC) weight for the most recent week in June was 852.2 million lbs. (387,364 metric tons). This was 4.5 percent more than the 815.2 million lbs. during the corresponding week in June 2024. Dressing percentage was a nominal 76.0 percent. For 2025 to date RTC broiler production attained 19.777 million lbs. (8.99 million metric tons). This quantity was 3.4 percent more than for the corresponding period in 2024.
The USDA posted live-weight data for the past week ending June 14th and YTD 2025 included:-
|
Live Weight Range (lbs.)
|
<4.25
|
4.26-6.25
|
6.26-7.25
|
>7.76
|
|
Proportion past week (%)
|
15
|
27
|
26
|
32
|
|
Change from 2020 YTD (%)
|
-7
|
+4
|
-3
|
+10
|
May 2025 Frozen Inventory
According to the June 25th 2025 USDA Cold Storage Report, issued monthly, stocks of broiler products as of May 31st 2025 compared to May 31st 2024 showed differences with respect to the following categories:-
- Total Chicken category attained 754.4 million lbs. (342,905 metric tons) corresponding to approximately one week of production based on recent weekly RTC output. The May 31st 2025 inventory was up 1.0 percent compared to 747,092 million lbs. (389,587 metric tons) on May 31st 2024 and up 0.1 percent from the previous month of April 2025.
- Leg Quarters were down by 2.7 percent to 51.0 million lbs. compared to May 31st 2024 consistent with the data on exports. Inventory was down 6.5 percent from April 2025. Given the trend in inventory of leg quarters it is evident that this category continues to be shipped in varying quantities as the principal (97 percent) chicken export product to a number of nations with The top five importers representing 50.3 percent of the January-April 2025 chicken parts export total of 984,621 metric tons. Mexico was the leading importer with 23.1 percent followed by Cuba (8.9%); Taiwan, (7.0%); Philippines, (6.1%) and Canada, (5.2%)
- The Breasts and Breast Meat category was up 7.0 percent from May 31st 2024 to 223.9 million lbs. indicating a relatively higher domestic consumer demand despite concern over inflation in the cost of protein. May 31st 2025 stock was 0.1 percent lower than on April 30th 2025. The trend through the first four months of 2025 suggests stable but low retail and food service demand for the white meat category. This is despite promotion of chicken sandwiches by QSRs in the face of a higher cost for beef and an increasing pattern of eat-at-home consumption.
- Total inventory of dark meat (drumsticks legs, thighs and thigh quarters but excluding leg quarters) on May 31st 2025 decreased 1.6 percent from May 31st 2024 to 66.1 million lbs. This difference suggests an increase in domestic demand for lower-priced dark meat against the prevailing price of white chicken meat. Prevailing prices for competitive proteins offer an opportunity to increase domestic demand for this category with innovative product development and promotion.
- Wings showed a 10.0 percent increase from May 31st 2024, contributing to a stock of 57.6 million lbs. This category was 0.9 percent lower compared to April 30th 2025. Movement in stock over the past 12 months has demonstrated lower demand for this category due in part from competitive “boneless wings.” Increased consumption traditionally associated with significant sports events including the College Bowl and Super Bowl reduced the volumes of storage in January and February 2025. The progressive increase in unit price during 2024 plateaued in 2025 due to consumer fatigue and competition from competing protein snacks despite continued interest in professional and collegiate football.
- The inventory of Paws and Feet was 23.7 percent higher than on May 31st 2024 to 31.3 million lbs. Stock was was 3.9 percent lower than on April 30th 2025. Prior to the April 2020 Phase-1 Trade Agreement approximately half of the shipments of paws and feet destined for Hong Kong were landed and transshipped to the Mainland, a trend that is re-emerging.
- The Other category comprising 311.2 million lbs. on May 31st 2025 was down 4.0 percent from May 31st 2024 but represented a substantial 41.3 percent of inventory. The high proportion of the Other category suggests further classification or re-allocation by USDA to the designated major categories.
May 2025 Processed Broiler Production
The USDA Poultry Slaughter Report released on June 25th 2025 covered May 2025 comprising 22 working days, one less than May 2024. The following values were documented for the month:-
- A total of 795.8 million broilers were processed in May 2025, down 18.0 million or 2.5 percent from May 2024;
- Total live weight in May 2025 was 5,286 million lbs., down 13.8 million lbs. or 0.3 percent from May 2024;
- Unit live weight in May 2025 was 6.64 lbs., down 0.13lb. (2.0 percent) May 2024.
- RTC in May 2025 attained 3,991 million lbs., down 21.4 million lbs. or 0.5 percent from May 2004.
- WOG yield in May 2025 was 75.5 percent, down from 75.7 percent in May 2024.
- The proportion marketed as chilled in May 2025 comprised 92.9 percent of RTC output compared to 93.7 percent in May 2024.
- Ante-mortem condemnation as a proportion of live weight attained 0.18 percent during May 2025 unchanged from May 2024.
- Post-mortem condemnations as a proportion of processed mass corresponded to 0.43 percent during May 2025 compared to 0.46 percent in May 2024.
Comments
Mexico has recognized the OIE principle of regionalization after intensive negotiations between SENASICA and U.S. counterpart, the USDA-APHIS assisted by USAPEEC. Provided importing nations adhere to OIE guidelines on regionalization, localized outbreaks of avian influenza or possibly Newcastle disease will affect exports only from states or counties with outbreaks in commercial flocks. The response of China, Japan and some other nations is more predictable with bans placed on a nationwide or statewide basis. The response by China to outbreaks is influenced more by self-interest than considerations of scientific fact or international trade obligations. Other importing nations have confined restrictions to counties following the WOAH principle of regionalization. The challenge facing the U.S. as the second largest exporting nation will be to gain acceptance for controlled vaccination against HPAI in specific industry sectors and regions with appropriate surveillance and certification to the satisfaction of importing nations.
Collectively our NAFTA/USMCA neighbors imported broiler products to the value of $471 million over the first four months of 2025 representing 30.8 percent of export value.
|
Meat Projection June 2025
|
06/25/2025 |
|
 Updated USDA-ERS Poultry Meat Projection for December 2024. Updated USDA-ERS Poultry Meat Projection for December 2024.
On June 18th 2024 the USDA-Economic Research Service released updated production and consumption data with respect to broilers and turkeys, covering 2024, a projection for 2025 and a forecast for 2026.
The 2025 projection for broiler production is for 47,500 million lbs. (21.591 million metric tons) up 1.2 percent from 2024. USDA projected per capita consumption of 101.9 lbs. (46.3 kg.) for 2025, up 0.9 percent from 2024. Exports will attain 6,588 million lbs. (2.995 million metric tons), 2.0 percent below the previous year.
The 2026 USDA forecast for broiler production will be 48,100 million lbs. (21.864 million metric tons) up 1.1 percent from 2025 with per capita consumption up 0.7 lb. to 102.6 lbs. (46.6 kg). Exports will be 1.2 percent higher compared to 2025 at 6,670 million lbs. (3.031 million metric tons), equivalent to 14.5 percent of production.
Production values for the broiler and turkey segments of the U.S. poultry meat industry are tabulated below:-
|
Parameter
|
2024
(actual)
|
2025
(projection)
|
2026
(forecast)
|
Difference
2024 to 2025
|
|
Broilers
|
|
|
|
|
|
Production (million lbs.)
|
46,994
|
47,580
|
48,100
|
+1.2
|
|
Consumption (lbs. per capita)
|
101.0
|
101.9
|
102.6
|
+0.9
|
|
Exports (million lbs.)
|
6,724
|
6,588
|
6,670
|
-2.0
|
|
Proportion of production (%)
|
14.3
|
13.8
|
13.9
|
-3.5
|
|
|
|
|
|
|
|
Turkeys
|
|
|
|
|
|
Production (million lbs.)
|
5,121
|
4,806
|
5,080
|
-6.2
|
|
Consumption (lbs. per capita)
|
13.8
|
13.0
|
13.5
|
-5.8
|
|
Exports (million lbs.)
|
486
|
405
|
435
|
-16.7
|
|
Proportion of production (%)
|
9.5
|
8.4
|
8.6
|
-11.6
|
Source: Livestock, Dairy and Poultry Outlook released June 18th 2025
The June USDA report updated projection for the turkey industry for 2025 including annual production of 4,806 million lbs. (2.185 million metric tons), down 6.2 percent from 2024. Consumption in 2025 is projected to be 13.0 lbs. (5.9 kg.) per capita, down proportionately by 5.8 percent from the previous year. Export volume will attain 405 million lbs. (184,090 metric tons) in 2025. Values for production and consumption of RTC turkey in 2025 are considered to be realistic, given year to date data, the prevailing economy, variable weekly poult placements, production levels, reduced losses from HPAI and inventories consistent with season.

The 2026 forecast for turkey production is 5,080 million lbs. (2.309 million metric tons) up an optimistic 5.7 percent from 2025 with per capita consumption up an unsubstantiated 3.8 percent to 13.5 lbs. (6.1 kg). Exports will be 19.7 percent higher than in 2025 to 435 million lbs. (197,728 metric tons) equivalent to 8.6 percent of production.
Export projections do not allow for a breakdown in trade relations with existing major partners including Mexico, Canada and China nor the impact of catastrophic diseases including HPAI and vvND in either the U.S. or importing nations
|
Turkey Month
|
12/23/2024 |
|
Monthly Turkey Production and Prices, December 27th 2024
Poult Production and Placement:
The December 13th 2024 edition of the USDA Turkey Hatchery Report, issued monthly, documented 24.66 million eggs in incubators on December 1st 2024 compared to 25.35 million eggs on December 1st 2023* The December 2024 set was down 0.68 million eggs (2.7 percent) from December 2023 and 0.19 million eggs (0.8 percent) from than the previous month of November 2024.
A total of 21.02 million poults were hatched during November 2024 down 0.65 million poults (3.0 percent) compared to 21.67 million in November 2023*. The November 2024 hatch was almost unchanged (down 4,000 poults) from the previous month of October.
A total of 19.27 million poults were placed on farms in the U.S. in November 2024, compared to 19.94 million in November 2023*. The November 2024 placement was 0.67 million poults (3.4 percent) less than in October 2023. The November placement was 0.11 million higher than the previous month of October. This data confirms disposal of 1.75 million poults during the month. Approximately 8.3 percent of the November 2024 hatch was not placed.
For the twelve-month period December 2023 through November 2024 inclusive, 252.03 million poults were hatched and 235.42 million were placed. This confirms disposal of 16.61 million poults over the 12-month period, corresponding to 6.6 percent of all poults hatched.
* USDA revision from previous monthly report.
Turkey Production:
The December 20th 2024 edition of the Turkey Market News Reports documented the following provisional data for turkeys slaughtered under Federal inspection:-
- For the processing week ending December 14th 2024, 1.393 million hens were processed at 17.7 lbs. live. This was 37.9 percent less than the 2.242 million hens processed during the corresponding week in November 2024 and 21.1 percent more than the 1.765 million processed during the corresponding week in December 2023. Hen slaughter year-to-date has attained 81.1 million, 11.3 percent less than for the corresponding period in 2023.
- Ready to cook (RTC) weight for hens over the most recent week was 19.83 million lbs. (9,012 metric tons). This quantity was 29.8 percent less than the 28.25 million lbs. for corresponding week in November 2024 and 9.7 percent less than the 21.97 million lbs. during the corresponding week in December 2023. Dressing percentage was a nominal 80.5 percent. For 2024 to date RTC hen production attained 1,111 million lbs. (504,836 metric tons). This quantity is 11.1 percent less than for the corresponding period in 2023.
- For the processing week ending December 14th 2024, 1.974 million toms were processed at 43.4 lbs. live. This was 4.6 percent less than the 2.070 million toms processed during the corresponding week in November 2024 and 8.1 percent less than the 2.148 million during the corresponding week in December 2023. Year-to-date 99.75 million toms have been processed, 0.9 percent less than for the corresponding period in 2023.
- Ready to cook (RTC) weight for toms during the most recent week was 69.0 million lbs. (31,356 metric tons). This quantity was 0.5 percent less than the 72.7 million lbs. processed during the corresponding week in November 2024 and 9.5 percent less than the 76.2 million lbs. during the corresponding week in December 2023. Dressing percentage was a nominal 80.5 percent. For 2024 to date RTC tom production attained 3,559 million lbs. (1.618 million metric tons). This quantity is less than 0.1 percent more than the corresponding period in 2023.
Wholesale Prices
The National average frozen hen price (8 to 16 lbs.) for conventional birds during the week ending December 20th was 104.0 cents per lb., 7.7 cents per lb. above than the previous month in 2024 and down 20 cents per lb. from the three-year average of approximately 124 cents per lb. The following prices rounded to the nearest cent were documented in the new format report for domestic and export trading for December 2024 as reported on December 20th:-
|
Product
|
cents per lb.
|
Change from previous Month (%)
|
|
Frozen hens whole Grade A (8-16 lb)
|
104
|
+8.3
|
|
Frozen toms whole Grade A (16-24 lb)
|
105
|
+11.7
|
|
Thighs (bone in)
|
Not listed
|
-
|
|
Necks (toms, export)
|
104
|
+7.7
|
|
Breasts 4-8 lb. (fresh)
|
Not listed
|
-35.8
|
|
Breasts B/S (toms, fresh)
|
165
|
-
|
|
Drums (toms)
|
114
|
+4.6
|
|
Wings (full-cut tom)
|
112
|
+4.7
|
|
Tenderloins
|
218
|
+67.6
|
|
Thigh Meat (skin and boneless)
|
191
|
+3.2
|
|
Mechanically Separated (domestic)
(export)
|
52
Not listed
|
+8.3
-
|

|
Meat Exports
|
11/19/2024 |
|
U.S. Broiler and Turkey Exports, January-September 2024.
OVERVIEW
 Total exports of bone-in broiler parts and feet during January-September 2024 attained 2,441,412 metric tons, 10.5 percent lower than in January-September 2023 (2,728,128 metric tons). Total value of broiler exports decreased by 3.0 percent to $3,441 million ($3,548 million). Total exports of bone-in broiler parts and feet during January-September 2024 attained 2,441,412 metric tons, 10.5 percent lower than in January-September 2023 (2,728,128 metric tons). Total value of broiler exports decreased by 3.0 percent to $3,441 million ($3,548 million).
Total export volume of turkey products during January-September 2024 attained 164,124 metric tons, 4.9 percent more than in January-September 2023 (156,421 metric tons). Total value of turkey exports increased by 8.6 percent to $490.5 million ($451.6 million).
Unit price for the broiler industry is constrained by the fact that leg quarters comprise over 96 percent of broiler meat exports by volume (excluding feet). From the first quarter of 2021 through late 2022, the value of leg quarters increased in unit value consistent with international demand but followed by a decline in 2023. Leg quarters represent a relatively low-value undifferentiated commodity lacking in pricing power. Exporters of commodities are subjected to competition from domestic production in importing nations. Generic products such as leg quarters are vulnerable to trade disputes and embargos based on real or contrived disease restrictions. To increase sales volume and value the U.S. industry will have to become more customer-centric following the lead of Brazil offering value-added presentations with attributes required by importers. Whether this will increase margins is questionable given the by-product contribution of leg quarters. A more profitable strategy for the U.S. industry would be to develop products using dark meat to compete with and displace pork and beef in the domestic retail and institutional markets.

HPAI is now accepted to be a panornitic affecting the poultry meat industries of five continents with seasonal and sporadic outbreaks. The incidence rate and location of cases in the U.S. limits eligibility for export depending on restrictions imposed by importing nations
Ongoing outbreaks of African swine fever in China and Southeast Asia from early 2019 and Europe from 2020 onwards reduced the availability of pork. In addition, disruptions in chicken production and logistics due to COVID restrictions decreased availability of protein with international repercussions on trade in chicken and pork. The demand for pork imports to China has diminished with restoration of domestic hog production to the extent of overproduction. Mild oversupply is evident in the white-feathered broiler sector with implications for exports other than feet extending into 2024.
|
Poultry Meat Projection September 2024
|
09/20/2024 |
|
Updated USDA-ERS Poultry Meat Projection for September 2024.
On September 18th 2024 the USDA-Economic Research Service released updated production and consumption data with respect to broilers and turkeys, covering 2023 a projection for 2024 and a forecast for 2025.
The 2024 projection for broiler production is 47,109 million lbs. (21.403 million metric tons) up 1.6 percent from 2023. USDA projected per capita consumption of 102.0 lbs. (46.4 kg.) for 2024, up 2.6 percent from 2023. Exports will attain 6,766 million lbs. (3.075 million metric tons), 6.7 percent below the previous year.
The 2025 USDA forecast for broiler production will be 47,675 million lbs. (21.670 million metric tons) up 1.2 percent from 2024 with per capita consumption up 0.5 lb. to 102.5 lbs. (46.6 kg). Exports will be 1.6 percent higher compared to 2024 at 6,875 million lbs. (3.125 million metric tons), equivalent to 14.5 percent of production.
Production values for the broiler and turkey segments of the U.S. poultry meat industry are tabulated below:-
|
Parameter
|
2023
(actual)
|
2024
(projection)
|
2025
(forecast)
|
Difference
2023 to 2024
|
|
Broilers
|
|
|
|
|
|
Production (million lbs.)
|
46,387
|
47,109
|
47,675
|
+1.6
|
|
Consumption (lbs. per capita)
|
99.5
|
102.0
|
102.5
|
+2.5
|
|
Exports (million lbs.)
|
7,260
|
6,776
|
6,875
|
-6.8
|
|
Proportion of production (%)
|
15.7
|
14.4
|
14.4
|
-8.3
|
|
|
|
|
|
|
|
Turkeys
|
|
|
|
|
|
Production (million lbs.)
|
5,457
|
5,130
|
5,175
|
-6.0
|
|
Consumption (lbs. per capita)
|
14.8
|
13.9
|
13.8
|
-6.1
|
|
Exports (million lbs.)
|
490
|
507
|
530
|
+3.5
|
|
Proportion of production (%)
|
9.0
|
9.9
|
10.2
|
+10.0
|
Source: Livestock, Dairy and Poultry Outlook released September 18th 2024
The September USDA report updated projection for the turkey industry for 2024 including annual production of 5,130 million lbs. (2.332 million metric tons), down 6.0 percent from 2023. Consumption in 2024 is projected to be 13.9 lbs. (6.3 kg.) per capita, down 6.1 percent from the previous year. Export volume will increase by 3.5 percent in 2024 to 507 million lbs. (230,455 metric tons). Values for production and consumption of RTC turkey in 2024 are considered to be realistic, given year to date data, the prevailing economy, variable weekly poult placements, production levels, freedom from HPAI and inventories.
The 2025 forecast for turkey production is 5,175 million lbs. (2.352 million metric tons) up 1.2 percent from 2024 with per capita consumption down 0.7 percent to 13.8 lbs. (6.3 kg). Exports will be 5.0 percent higher than in 2024 to 530 million lbs. (240,910 metric tons) equivalent to 10.0 percent of production.
Export projections do not allow for a breakdown in trade relations with existing major partners including Mexico, Canada and China nor the impact of catastrophic diseases including HPAI and vvND in either the U.S. or importing nations
Compared to 2022 exports of broiler products to China during 2024 were 34 percent lower in volume to 405,343 metric tons and 34 percent lower in value to $711 million. For the first half of 2024 broiler volume to 4th-ranked China by volume of imports was down 62 percent from the corresponding months in 2023 to 92,069 metric tons. Value was down 54 percent to $183 million
Subscribers are referred to the monthly export report in this edition and update of production data and cold storage inventories of broilers and turkeys respectively posted in each end-of- month edition of CHICK-NEWS with the previous monthly data under the STATISTICS tab.
|
USDA Export Projections For Chicken
|
09/02/2022 |
|
 Based on the August 12th, 2022 World Agricultural Supply and Demand Estimates, USDA has projected chicken exports for 2022 with a forecast for 2023. Based on the August 12th, 2022 World Agricultural Supply and Demand Estimates, USDA has projected chicken exports for 2022 with a forecast for 2023.
Broiler meat exports will amount to 3.3 million metric tons in 2022 valued at $4.2 billion. For 2023, volume and value will be unchanged, representing a unit price excluding feet, which are not federally inspected, at $1,272 per metric ton.
 The 2023 exports of all agricultural products will amount to $193.5 billion in 2023, balanced by imports of $197.0 billion resulting in a negative annual balance of $3.5 billion. The 2023 exports of all agricultural products will amount to $193.5 billion in 2023, balanced by imports of $197.0 billion resulting in a negative annual balance of $3.5 billion.
|
|
|
|

|
| |
Copyright © 2026 Simon M. Shane
|
|
|