Editorial
|
QSR Margins on Beef are Squeezed-- an Opportunity for Chicken?
|
|
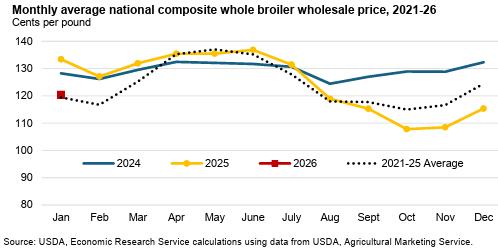
The recent Producer Price Index (PPI) for February 2026 showed red meat prices rising faster than national wholesale prices. Beef and veal were up 1.8 percent in February compared to 0.7 percent for the PPI with a 13 percent increase over 12 months. It is estimated that the price for live cattle rose 5 percent in February and 20 percent year-over-year compared to chicken that was up 1.1 percent in February but down 7.4 percent from February 2025.
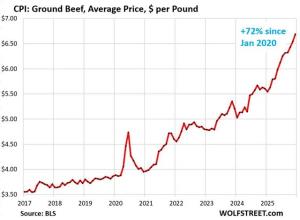
This data is supported by the Datassential Burger Price Index, documenting a 14 percent increase since January 2023. The burger-oriented QSRs, including McDonald’s, Burger King and Wendy’s face a margin squeeze with wholesale prices for ground beef outpacing the menu board.

Jim Emling, CEO of Datassential, stated, “Operators cannot simply pass every cost increase directly to the consumer.” He added, “The data shows how carefully restaurants are managing pricing on high-visibility items like burgers while balancing costs across the rest of the menu.” Burger prices at casual dining restaurants have increased by 16 percent since 2023 compared to full-service restaurants at 12 percent. It is evident that selling a high proportion of beef burgers will impact margins and hence profit. To maintain traffic in a price-sensitive environment, many QSRs are offering value meals for lunch and dinner mealtimes as confirmed by the comments by McDonald’s CEO in the FY 2025 Investors’ call. We can expect that “value burgers” will undergo ‘shinkflation’.
 USDA projections in the March 2026 Livestock, Dairy and Poultry Outlook show the net availability of beef increasing 4.1 percent for the current year over 2025. Domestic production will be up 226,810 million pounds of RTC, representing a 3.1 percent increase. Net availability from foreign producers will increase by 13.3 percent to 3,280 million pounds. Despite increases in price, beef demand remains robust, putting pressure on restaurants and institutions. USDA projections in the March 2026 Livestock, Dairy and Poultry Outlook show the net availability of beef increasing 4.1 percent for the current year over 2025. Domestic production will be up 226,810 million pounds of RTC, representing a 3.1 percent increase. Net availability from foreign producers will increase by 13.3 percent to 3,280 million pounds. Despite increases in price, beef demand remains robust, putting pressure on restaurants and institutions.
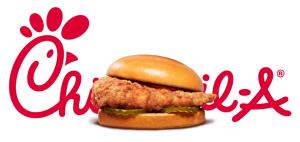
The cost factors contributing to lower margins from beef patties represent an opportunity for chicken. The success of Chick-fil-A and Popeye’s Louisiana Kitchen stimulated by the “chicken sandwich wars” of 2025 indicate the acceptability of chicken as a replacement for the traditional beef burger. Now is the time for the broiler industry to develop new chicken-based menu items for QSRs and casual dining restaurants. With respect to filets and breast meat, QSRs will compete with consumers for a range of chicken products available in supermarkets and club stores for home preparation. Accordingly, the industry should actively fund research into innovative products and develop hybrid presentations that can go between the buns, that will be superior in taste and texture to conventional burgers.
The U.S. broiler industry relies on the annual revenue amounting to $4.5 billion from the export of undifferentiated leg quarters representing 14 percent of RTC production. Dark meat at a lower cost compared to the front half of the bird could be blended with white meat to produce a product suitable for QSRs and acceptable to consumers. As has previously been stated, the U.S. cannot rely on continued growth or even stability in export volume and value, given the challenges of competition from Brazil, increased domestic production by 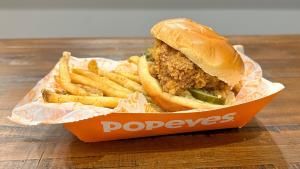 importing nations, restrictions over avian influenza, tariff disputes and geopolitical considerations These factors together with rising transport costs are making the U.S. less competitive. importing nations, restrictions over avian influenza, tariff disputes and geopolitical considerations These factors together with rising transport costs are making the U.S. less competitive.
The current turbulence in world trade and the evident market for a chicken-based alternative to beef patties offers a win-win solution for both the broiler industry and QSRs.

|
|
Poultry Industry News
|
Kroger Company Posts Q4 and FY 2025 Results
|
|
 On March 5th The Kroger Company (KR) posted results for Q4 and FY 2025 ending January 31st 2025. Kroger was two percent below consensus revenue and four percent below expectations for adjusted EBITDA but posted higher guidance for FY 2026. On March 5th The Kroger Company (KR) posted results for Q4 and FY 2025 ending January 31st 2025. Kroger was two percent below consensus revenue and four percent below expectations for adjusted EBITDA but posted higher guidance for FY 2026.
Kroger is the second largest retailer of groceries in the U.S. and is a pure supermarket play subject to the pressures of escalation in food costs, logistics and labor and the impact of inflation in common with all national and regional competitors.
For Q4 Kroger reported earnings of $861 million on sales of $34,725 million with a diluted EPS of $1.35. For the corresponding Q4 of FY 2024, Kroger earned $634 million on sales of $34,308 million with a diluted EPS of $0.90. Comparing Q4 of 2025 with the corresponding quarter of FY 2024, sales were 1.2 percent higher; Gross margin increased from 23.1 percent for Q4 FY 2024 to 23.4 percent for the most recent quarter. Operating margin increased from 2.0 percent in Q4 2024 to 3.6 percent for Q4. For the last quarter in 2025 S&G was lower by $93 million compared to Q4 FY 2024. Improvements were attributed to reducing supply chain costs, improved sourcing and with lower shrink of inventory.
For FY 2025 Kroger reported earnings of $1,016 million on sales of $113,240 million with a diluted EPS of $1.54. For the corresponding FY 2024, Kroger earned $2,685 million on sales of $147,123 million with a diluted EPS of $3.67. During FY 2025 Kroger posted an impairment charge of $2,497 million attributed to the Ocada fulfillment network
In commenting on quarterly results in the press release, Greg Foran the newly appointed CEO stated “Kroger delivered a strong finish to the year, with improving market share trends and solid

sales growth that reflect meaningful progress in strengthening the business. He added
“We have the right foundation in place, and I’m focused on making it even stronger by
delivering more value to customers, improving the customer experience in stores and online,
and driving cost savings and productivity to fund our growth."
In addressing analysts Foran opined “It has been about a month since I started, and I’ve spent that time learning Kroger from the inside out. I’ve been spending time with the leadership team, having one-on-one conversations across the organization and getting out to the stores, distribution centers and manufacturing facilities — and, importantly, also watching how our customers shop”. He added “The team has done excellent work, particularly over the past year, to strengthen the business. And my focus is on how we ‘operationalize’ our strategy to make us even better.”
In discussing future developments, Foran pointed to private Kroger brands that experienced a solid quarter, he stated, “Excluding the impact of egg deflation, sales continue to outpace national brands. Simple Truth and Private Selection again led our growth, with customers continuing to choose these products because they deliver high quality and an affordable price. Innovation continues to be a priority. This year, we introduced more than 1,100 new Our Brands products, up from more than 900 last year. A growing number of these products are focused on health, an area where customer demand is growing, and the Our Brands portfolio is well-positioned to lead.”
The challenge facing Greg Foran will be to stabilize operations and implement envisaged improvements. Kroger is recovering from the turbulence, distractions and expenses associated with the thwarted acquisition of Albertsons. The move away from mechanized Ocada fulfillment centers of which 20 additional were planned will reduce unprofitable future capital commitment.
The Company released adjusted FY 2026 Guidance:-
- Identical Store Sales growth of 1.0 to 2.0 percent excluding fuel,
- Adjusted EPS of $5.10 to $5.30.
- Adjusted FIFO Operating Profit of $5.0 billion to $5.2 billion.
- Capital expenditure of $3,800 to $4,000 million,
Comparable same-store sales for Q4 advanced by 2.4 percent (excluding fuel) compared to Q4 FY 2024; Digital sales were up by 20.0 percent;
On January 31st 2025 Kroger posted total assets of $49,941 million, of which $3,403 million comprised goodwill and intangibles. Long-term debt and lease obligations amounted to $24,405 million.
The Kroger Company had an intraday market capitalization of $43,440 million on March 6th 2026. The Company has traded over the past fifty-two weeks in a range of $58.60 to $74.90 with a 50-day moving average of $64.96. KR trades with a forward P/E of 12.8. On March 4th 2026 KR closed at $66.02 pre-release but at 09H00 on March 5th post-release share price rose 6.6 percent to $70.40, closing at $74.00.

Insiders hold 8.8 percent of equity with 79.2 percent held by institutions. On February 13th 5.2 percent of the float was short.
Twelve-month trailing operating margin was 3.5 percent and profit margin 0.7 percent. The Company generated a return on assets of 5.6 percent and 14.4 percent on equity
The Kroger Company operates approximately 2,750 stores (with 1,240 under the Kroger banner), but with a total of 25 banners in 35 states. In addition Kroger operates 2,270 pharmacies and 1,700 fuel centers, 34 food plants and 45 distribution centers.
|
Cal-Maine Foods Reports on Q3 FY 2026
|
|
In a release dated April 1st 2026 Cal-Maine Foods Inc. (CALM) announced results for the 3rd Quarter of FY 2026 ending February 28th 2026. This review summarizes data provided in the Company release and the concurrently filed SEC 10-Q Report.
Cal-Maine Foods exceeded the analysts’ revenue estimate of $642 million by 3.9 percent achieving $667 million. The consensus estimate for EPS of $0.76 was exceeded by 39.5 percent at $1.06.
It is noted that market conditions during Q3 2026 were less favorable compared with Q3 2025 resulting in an average Cal-Maine unit revenue of $1.77 per dozen for all eggs, compared to a corresponding price of $4.06 per dozen, a decline of 56.5 percent. Financial results that were above Street consensus for revenue and EPS raised CALM price from the pre-release value of $79.04 at the close on March 31st by 6.0 percent to $83.82 at noon April 1st.
Despite acquiring further-processing enterprises, Cal-Maine still represents a bellwether for the shell egg sector as the only public-quoted company in the U.S. industry, supplying close to 22 percent of domestic shell egg consumption and encompassing all varieties. The following table summarizes the results for the period compared with the values for the corresponding quarter of the previous fiscal year (Values expressed as $ x 1,000 except EPS)
|
3rd Quarter FY Ending
|
February 28th
2026
|
March 1st
2025
|
Difference (%)
|
|
Sales:
|
$666,951
|
$1,417,685
|
-53.0
|
|
Gross profit:
|
$119,283
|
$716,115
|
-83.3
|
|
Operating income :
|
$35,994
|
$635,670
|
-94.3
|
|
Pre-tax income
Net income
|
$58,186
$50,459
|
$663,029
$508,553
|
-91.2
-90.1
|
|
Diluted earnings per share:
|
$1.06
|
$10.38
|
-88.8
|
|
Gross Margin (%)
|
17.9
|
50.5
|
-64.5
|
|
Operating Margin (%)
|
5.4
|
44.8
|
-87.9
|
|
Profit Margin (%)
|
7.6
|
35.9
|
-78.8
|
|
Non-current liabilities Feb. 28 2026/ May 31 2025
|
$34,625
|
$55,582
|
-37.7
|
|
12 Months Trailing:
|
|
|
|
|
Return on Assets (%)
|
32.3
|
|
|
|
Return on Equity (%)
|
48.5
|
|
|
|
Operating Margin (%)
|
16.3
|
|
|
|
Profit Margin (%)
|
27.4
|
|
|
|
Total Assets Feb. 28 2026/May 31 2025
|
$3,193,261
|
$3,084,619
|
+3.5
|
|
Market Capitalization April 1 2026/ Aug. 31 2025
|
$4,490,000
|
$4,000,000
|
+12.5
|
Notes: $22.2 million ‘other income,’ (including $11.2 million interest earned and $11.7 million patronage presumably E-B) in Q3 FY2026 compared to $27.4 million in Q3 FY2025:
CALM Trailing P/E =3.6. Beta = 0.25
52-Week Range in Share Price: $71.92 to $126.40. 50-day Moving average of $83.45
Market close, Tuesday. March 31st $79.04 pre-release.
Market noon, Wednesday, April 1st $83.84
Shareholding distribution:- 92.5 percent of shares held by institutions; 10.0 percent insiders; 13.1 percent of float was short on March 13th
Revenue Comparison Q3 2026 v Q3 2025
Revenue Category. Q3 2026. Q3 2025
Conventional eggs. (%) 42.4. 71.7
Specialty eggs (%). 43.4. 23.2
Prepared Foods (%). 9.5. 0.8
Egg products. (%) 2.8. 3.5
Other (%) 1.9. 0.8
Total (%). 100.0. 100.0
Q3 Value $ million $666.9. $1,417.7
CONTRIBUTION OF CAL-MAINE PRODUCT SEGMENTS TO Q3 REVENUE
Channel Category. Q3 2026. Q3 2025
Retail (%). 84.1. 84.6
Foodservice (%). 14.1. 14.6
Other (%). 1.8. 0.8
Total (%). 100.0. 100.0
Q3 Value $ million $666.9. $1,417.7
CONTRIBUTION OF CAL-MAINE CHANNEL SEGMENTS TO Q3 REVENUE
In reviewing the CALM Q3 FY2026 report and the SEC 10-Q submission the following values represent key data for the most recent Quarter (with Q3 FY2025 and percentage differences in parentheses for comparison):-
Conventional shell-egg sales attained $283.2 million in Q3 2026. This category of shell eggs comprised 42.4 percent of total shell egg revenue. ($572.3 million, in Q3 2025, based on 71.7 percent of revenue. Sales value for conventional shell eggs was down 70.0% reflecting lower average unit value for this category).
- Specialty shell-egg sales attained $289.1 million in Q3 2026. This category of shell eggs comprised 42.4 percent of total shell egg revenue. ($1,345,382 million, in Q3 2025, based on 23.2 percent of revenue. Sales value for specialty shell eggs was down 16.9% reflecting lower average unit value for this category).
- Prepared Foods sales attained $63.6 million in Q3 2026. This category comprised 9.5 percent of total revenue. ($11.7 million, in Q3 2025, based on 0.8 percent of revenue). Sales value for Prepared Foods was up 441% reflecting the contributions of Joint Venture Crepini Foods and recently acquired Echo Lake Foods.
- Egg Product sales attained $18.4 million in Q3 2026. This category comprised 2.8 percent of total revenue. ($49.3 million, in Q3 2026, based on 3.5 percent of total revenue). Sales value for Egg Products was down 62.7% reflecting lower volume of liquids with diversion to higher value egg products.
- Sales to the Retail Channel attained $560.8 million in Q3 2026, comprising 84.1 percent of total revenue ($1,199,697 million in Q3 2025, representing 84.6%) Sales to the Food Service sector attained $94.4 million in Q3 2026, comprising 14.1 percent of segment revenue ($207.3 million in Q3 2025, representing 14.6% of total revenue)
- Dozen shell eggs sold (thousands): 324,059 (331,395; -2.2%)
- Average selling price of all shell eggs: $1.766 per dozen; ($4.060 per dozen; -56.5%).
- Average selling price of specialty eggs (excluding co-pack): $2.313 cents per dozen; ($2.784 per dozen; -16.9%).
- Average selling price of conventional eggs: $1.423 cents per dozen; ($4.766 cents per dozen; -70.1%).
- Differential benefiting specialty eggs over conventional eggs: $0.89 per dozen; (-$1.982 cents per dozen.)
- Specialty eggs as a proportion of volume sold: 38.6%; (35.7%; -8.1%)
- Specialty eggs as a proportion of sales value: 50.5%; (24.4%; +107.0 %)
- Proportion of eggs sold that were produced by Cal-Maine and their contract flocks in Q2 2026: 91.5% (88.4%; +3.5%).
- Cost of purchased eggs: $2.88 per dozen reflecting 27.6 million dozen valued at $79.5 million
- Feed cost 49.4 cents per dozen (including specialty and breeder diets) (49.2 cents per dozen, down 0.4%)
The Q3-2026 10-Q report contained the following statements on pricing:-
“The majority of our conventional eggs are priced and sold under frameworks that generally utilize market-based formulas tied to independently quoted regional wholesale market quotes. The majority of our specialty eggs are sold under frameworks that do not utilize market-based formulas, although we do have some customers that prefer market-based pricing for cage-free eggs. As a result, specialty egg prices typically do not fluctuate as much as conventional pricing”.
“During first quarter fiscal 2026, a higher proportion of our conventional eggs were sold on a hybrid pricing model that takes into account both our cost of production as well as wholesale market prices, instead of solely market-based pricing, in response to customer demand. We believe the hybrid pricing arrangement may help some customers better plan and manage their businesses and reinforces our role as a trusted supplier. Although hybrid pricing may reduce our profitability when egg prices are high, compared to pure market-based pricing, it could enhance our profitability when egg prices are low, and lead to reduced volatility in our financial results. A majority of our conventional eggs continue to be priced and sold under frameworks that generally utilize market-based formulas tied to independently quoted regional wholesale market quotes”.
The top three customers in FY 2025 represented 49.2 percent of sales value, with Walmart and Sam’s Club comprising 33.6 percent
Derived Q3 FY 2026 production costs for all categories of shell eggs expressed as cents per dozen (rounded) comprised:-
- Feed 49.4
- Production. 45.61
- Nest run. 95.0
- Packing 33.2
- Delivery. 8.6
- Marketing. 4.8
- Overhead. 12.42
Notes: 1.0 Provision for pullet depreciation, is presumably included in the ‘production’ expense category
2.0 Includes General and Administration expenses
3.0 Divisor 322.6 million dozen sold
Cal-Maine Foods maintained a flock of 48.0 million hens on February 28th 2025 reflecting acquisitions and growth, with 14.3 million pullets plus parent breeders representing under two percent of the total flock.
- Effective May 31st 2025 production capacities comprised1:-
- Hens: 51.8 million on 49 farms
- Pullets:14.3 million on 37 farms.
- Packing: 22,490 cph in 50 plants.
- Hatching: 356,300 pullet chicks per week in 2 facilities.
- Parent breeders: 215,000 hens.
- Feed : 1,000 tons per hour in 30 plants.
- Egg products: 72,700 lbs. per hour.
- To be updated after release of FY 2026 Annual Report
The following observations relate to the comparison of Q3 2026 with the corresponding Q3 2025:-
- Cal-Maine Foods was not affected by the HPAI epornitic during FY 2025. The Company reported the loss of 350,000 pullets in early March 2026 (Q4) on a farm in Maryland acquired from ISE in 2025. Management is applying appropriate biosecurity precautions as noted in the Analysts’ call.
- Comparing Q3 2026 with Q3 2025, gross profit was negatively impacted by lower unit revenue for conventional eggs but with minimal effect on specialty eggs. The average 4.4 percent higher feed cost to 49.4 cents per dozen. Cal-Maine recorded a 9.1 percent higher value for the ‘other farm production’ cost category including labor, consumables and maintenance.
- In a market characterized by low unit prices for conventional shell-eggs, the relative contribution of specialty eggs is more important to net earnings in contrast to an up-market for conventional eggs.
The Q3 press release repeated comments from previous reports noting “Significant progress on proactive steps to add production capacity and help mitigate the egg supply shortage across the country”, including:
- A 2.0% increase in the average number of layer hens during Q3 2026 compared to the prior-year quarter, reflecting repopulation of flocks and both organic and expansion by acquisition.
- A 13.0% increase in the Company’s breeder flocks during Q3 FY 2026 compared to the end of the prior-year quarter.
- A 42% increase in total chicks hatched during Q3 2026 compared to the prior-year quarter.
- Continued progress on ongoing organic expansion projects that are expected to add approximately 1.1 million cage-free layer hens and 250,000 pullets and contract production of 1.2 million free-range layer hens during FY 2026.
- Acquisitions over Q1 through Q3 amounted to $299 million.
- Clean Eggs LLC in Texas with a capacity of 667,000 hens with extensive acreage, pullet rearing and packing was purchased for $23.7 million representing a hen-equivalent value of $35.
- Creighton Bros. in Indiana with 3.2 million hens, pullet rearing, feed mill, packing and extensive acreage for $129 million representing a hen-equivalent value of $39.
- Added production support through the integration of recently acquired assets”
In commenting on Q3 results Sherman Miller CEO and president stated, “The shell egg market in the third quarter provided an important real-time test of our strategy. Periods of egg price softness highlighted that our performance is not simply a function of spot market conditions, but of how effectively we manage mix, pricing structures, costs, and capital across the cycle. Despite materially lower egg prices compared to the historic levels seen in the prior year, our diversified portfolio and operational execution enabled us to deliver solid results and maintain momentum. In our view, this reinforces the resilience of the model we are building that we expect will lead to more durable normalized earnings power”
Miller continued, “We believe the recent decline in wholesale egg prices reflects improved supply following prior-year HPAI disruptions, during our last fiscal quarter, depopulations reported by the USDA were down 70.6% and the average national layer flock increased 2.2%, year over year. In parallel, more stable purchasing patterns across retail and foodservice have contributed to lower wholesale prices, while retail pricing continues to adjust more gradually”.
He concluded “At the same time, we continue to invest in strengthening the long-term structure of the business. The acquisition of certain assets of Creighton Brothers and Crystal Lake advances several elements of our strategy simultaneously: expanding the scale and geographic reach of our shell egg platform, increasing internal sourcing capabilities for egg-based ingredients, and enhancing our ability to support the growth of our prepared foods business. By integrating shell egg production, egg products, and prepared foods more tightly within our value chain, we believe we can improve supply security, increase operational efficiency, and reinforce the economics of our prepared foods platform. Deploying capital into assets that deepen these structural advantages is central to our disciplined capital allocation framework”
Extracts from the 10-Q provided insight into Cal-Maine pricing and marketing including:-
“Our operating results are materially impacted by market prices for eggs and feed grains (corn and soybean meal), which are highly volatile, independent of each other, and out of our control. Generally, higher market prices for eggs have a positive impact on our financial results while higher market prices for feed grains have a negative impact on our financial results. Our pricing for shell eggs is negotiated with our customers on individual terms. We sell our shell eggs at prices based on formulas that take into account, in varying ways, independently quoted regional wholesale market prices for shell eggs, formulas related to our costs of production, such as grain-based and variations of cost-plus arrangements, or hybrid models including cost of production and wholesale market prices”.
“Almost all of our conventional eggs are priced and sold under frameworks that generally utilize market-based formulas tied to independently quoted regional wholesale market quotes or utilize the hybrid models described above. The majority of our specialty eggs are sold under frameworks that do not utilize market-based formulas and instead are based on cost of production, although we do have some customers that prefer market-based pricing for cage-free eggs. As a result, specialty egg prices typically do not fluctuate as much as conventional pricing. We do not sell eggs directly to consumers or set the prices at which eggs are sold to consumers”.
“During the first two quarters of fiscal 2026, a higher proportion of our conventional eggs were sold on a hybrid pricing model that takes into account both our cost of production as well as wholesale market prices, instead of solely market-based pricing, in
response to customer demand. We believe the hybrid pricing arrangement may help some customers better plan and manage their businesses and reinforces our role as a trusted supplier. Although hybrid pricing may reduce our profitability when egg prices are high, compared to pure market-based pricing, it could enhance our profitability when egg prices are low, and lead to reduced volatility in our financial results”.
With respect to production systems and the rate of transition to cage-free housing the Company Q-10 stated “We are focused on adjusting our cage-free production capacity with a goal of meeting the future needs of our customers in light of changing state requirements and our customers’ goals. As always, we strive to offer a product mix that aligns with current and anticipated customer purchase decisions. We are engaging with our customers to help them meet their announced goals and needs. We have invested significant capital in recent years to acquire and construct cage-free facilities, and we expect our focus for future expansion will continue to include cage-free facilities. Our volume of cage-free egg sales has continued to increase and account for a larger share of our product mix”.
“In Q3 of FY 2026, cage-free egg revenue represented approximately a third of our total shell egg revenue, compared to 23.4% in the Q3 of FY 2025. At the same time, we understand the importance of our continued ability to provide conventional eggs in order to provide our customers with a variety of egg choices and to address hunger in
our communities”.
As of April 14th Cal-Maine Foods ceased to be a “controlled company” with conversion of Class A shares to common stock. As part of the buy-back program the Company purchased shares to the value of $50 million from entities representing the Founder family. Future additional purchases valued at $450 million have been authorized by the Board.
Cal Maine Foods has expanded by purchase of existing integrated production facilities but has extended acquisitions to value-added products over the past two years.
The 10-Q Report filed on October 1st 2025 documented approved capital investment of $257.3 million for FY 2026. Provisions comprised a feed mill (3.8% of proposed capital expenditure); Egg products equipment (7.6%); Expansion of prepared Foods (5.8%) and new cage-free housing and conversions (82.8%). Of this total $210.2 million (81.7%) was committed with $47.1 million to be expended. There was no update of these values for Q3 2026
|
Brought to you by Val-Co
|
|
This special edition of CHICK-NEWS is sponsored by VAL-CO Industries in association with ONCE by Signify and features the Optient gradient lighting system. A combination of Optient Lighting and the FUZE V feeder pan will be demonstrated on the VAL-CO booth 1030 at PEAK. Company representatives will review experimental and field data confirming the financial benefits of the combination from enhancer feed conversion efficiency.
|
Optient Lighting System Offers Enhanced Margin and Improved Welfare
|
|
Introduction
The Optient gradient lighting system developed by Once by Signify offers improved welfare and increased margin through lower feed conversion. Although maximizing return is an important objective, it is possible to indirectly attain higher weight gain or lower feed conversion efficiency through upgrading welfare. Financial return can be optimized by producing a more saleable product with enhanced quality.
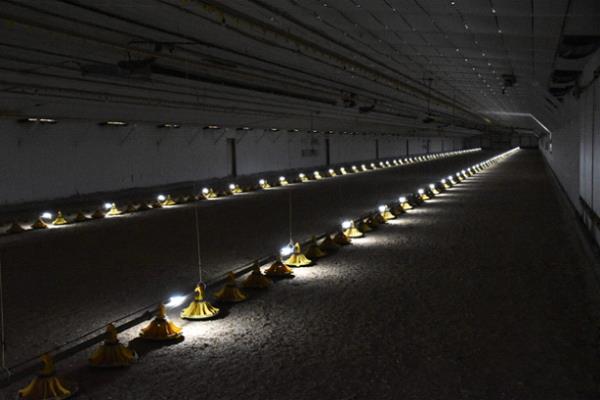
House with two feeder lines showing the
relative light intensities from the Optient gradient lighting system |
VAL-CO Industries has been appointed as the distributor of the Optient lighting system for the U.S. and Canada. The system is fully compatible with the FUZE® V feeder, and the combination provides synergy in flock performance, welfare, sustainability with an optimal grow-out margin.
The Science Supporting Gradient Lighting
It is evident that broiler chickens favor a variation in intensity of illumination. With gradient lighting feeding and drinking are stimulated at higher light intensity (30 to 40lux) compared to darker areas of the house (5 to 10 lux). These lower levels of light allow for natural behaviors including non-aggressive interaction, dust-bathing and resting. Gradient (variable area) light intensity in a house contrasts with traditional uniform lighting at 20 lux from ceiling fixtures that spread light evenly across the entire floor. Studies from 2009 onwards have examined the response of flocks to gradient lighting. This has generated data on quantifiable physiological responses and performance data confirming benefits for integrators.
A comprehensive evaluation of gradient lighting was conducted by the Center of Excellence for Poultry Science at the University of Arkansas in 2023*. Lighting regimes that were compared included intensities of 5 lux, 20 lux, natural light and gradient light ranging from approximately 5 lux in the dark areas to 40 lux adjacent to feeder lines.

The effects among the four treatments were compared with respect to conventional production parameters including live weight, daily weight gain, adjusted feed conversion efficiency, livability, skeletal integrity, gait and footpad scores. The study also involved an assessment of natural behaviors including curiosity, physical activity and dust bathing. The performance and behavioral factors were correlated with brain function including gene expression for neurotransmitters contributing to either stress or homeostasis.
With respect to the four growing trials terminating at 56, 51, 49 and 55 days respectively, the gradient light treatment consistently resulted in a very highly significantly lower adjusted feed conversion, approximating two points, compared to a house operated at 20 lux. Daily weight gain and final weight were also numerically superior. There was no statistical difference in total mortality through 49 days. The category designated “leg problems” was statistically lower in the gradient light treatment at a level of approximately 1.5 percent among the 4,880 broilers in each treatment, compared to higher values in the other three treatments. Cumulative mortality was in region of 5.4 percent among all four light treatments. It was considered important that litter was significantly drier in the house with the gradient light installation. This has implications for intestinal health and suppression of coccidiosis Moisture content was assessed by the number of zones in the house that yielded levels over 35 percent. Gradient light resulted in a factor of 0.2 compared to the 20-lux treatment at an average of 2.1 zones. Daily physical activity as measured electronically was significantly higher in the house with gradient light at 155 joules per day compared to 80 joules per day in the treatment grown with a uniform light intensity of 20 lux. This confirms that gradient light stimulates movement that is correlated with improved skeletal integrity and locomotory function. The number of dust bathing holes in litter signifying natural activity was significantly higher with gradient lighting compared to the 20-lux treatment on days 9, 16 and 23 during the trial.

Light affects the serotonin (5-HT) system in the brain stem. This parameter together with measurements of tryptophan hydroxylase 2, tyrosine hydroxylase and glucocorticoid receptor denoted reduced stress in broilers reared under gradient light. Measures of brain function are correlated with observed behavior of flocks. There are also positive relationships between neurotransmitters and enhanced production parameters including feed conversion efficiency, gait score and the prevalence of leg abnormalities in a flock. These benefits were attributed to the gradient lighting system contributing to increased movement in the house, less stress and higher feed and water intake compared to flocks exposed to a constant light intensity of 20 lux.
*Kang, S.W. et al. Effects of a variable light intensity lighting program on the welfare and performance of commercial broiler chickens. Frontiers in Physiology. doi.org/10.3389/fphys.2023. 1059055.
Field Trials
A team of scientists conducted a series of field evaluations comparing light intensities of 20 lux with gradient lighting using the Optient system. The series of comparisons was conducted from June 2023 through August 2024. The scope of the field trial involved seven integrators in five U.S. states (AR, MS, NC, TX and CA) and Ontario. Twentyfour comparisons involved ten farms with replication of whole-house comparisons. Harvest ages ranged from 39 to 58 days and live weights from 4.5 to 9.5 pounds.
Feed conversion efficiency was the important difference between the constant 20 lux and the gradient light treatments using the Optient system. There was a difference of 3 points in adjusted feed conversion with a p-value of 0.0001 confirming a very highly significant difference in favor of gradient lighting over ceiling lighting at a uniform 20 lux. There were no statistically significant differences in harvest weight, average daily gain or livability among the treatments compared in the meta-analysis.
Parameter. Gradient Lighting. Ceiling Lighting. Difference. P Value
Weight (lbs.). 7.58. 7.52. +0.06. 0.11
Adj. FCR. 1.75 1.78. -0.03 0.0001
Mortality (%). 5.4. 5.4. 0. n/a
Summary of 24 field trials comparing Optient Lighting with conventional ceiling lighting
Financial Value of Improved Feed Conversion
The very highly significant 3-point difference in feed conversion over 24 field trials, represents 0.12 pounds of feed per bird saved applying the live weights and adjusted feed conversion ratios for the Optient system compared to ceiling light, as tabulated in the previous section. The difference amounted to 8.25 tons of feed saved each year. This assumes 25,000 birds per house at 0.8ft.2 stocking density; a cycle length of 66 days (48 days growing plus 18 inter-cycle) contributing to 5.5 cycles per year for a total of 137,500 birds per house.
The financial benefit was calculated for a five-year period with the base cost of feed at $230 per ton, increasing by three percent annually. Applying a five percent discount factor to the annual benefits derived from feed saving, the value of the improved feed conversion efficiency amounted to $8,599.
The Optient installation in the house with a 25,000 flock would cost $6,500 compared to a conventional ceiling LED system at $8,000. The $1,500 differential added to the discounted annual benefits over five years provides a net present value of $10,099 for an Optient light system in the 500 by 40 ft. house.
Conclusion
The Optient lighting system manufactured by Once, a subsidiary of Signify is justified by feed saving. The range of scientific evaluations provides a mechanism for improved performance and welfare using gradient lighting for broilers. Field trials conducted on the Optient system established a 3-point improvement in feed conversion efficiency projecting realistic prices for feed over a five-year period confirming the financial benefit for integrators specifying the Optient gradient Lighting system. The contractor would benefit from reduced power consumption since Optient lights are rated at 2 watts compared to conventional LED ceiling lights at 10 watts. In addition, growers using gradient lighting would benefit from enhanced settlement payment with contracts specifying incentives for improved feed conversion or harvested weight livability or their combination.
|
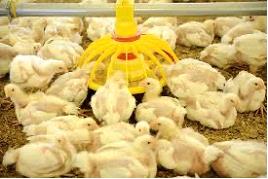
Monthly Broiler Production Statistics, February-March 2026
|
|
 Broiler Chick Placements, March 2026 Broiler Chick Placements, March 2026
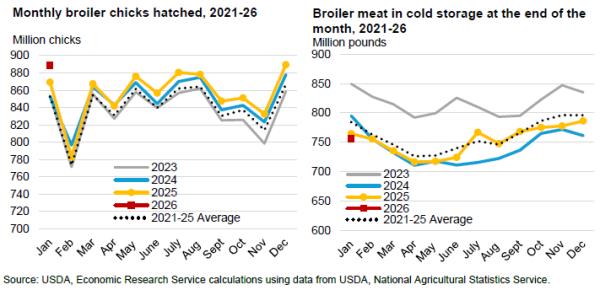
According to the March 18th 2026 USDA Broiler Hatchery Report, 1,269 million eggs were set over five weeks extending from February 14th through March 14th 2026 inclusive. This was approximately two percent higher compared to the corresponding period in 2025.
Total chick placements for the U.S. over the five-week period amounted to 973 million chicks. Claimed hatchability for the period averaged 78.7 Percent (79.2 percent for previous 5-week period) for eggs set three weeks earlier. Each 1.0 percent change in hatchability represents approximately 1.96 million chicks placed per week and 1.86 million broilers processed, assuming five percent culls and mortality and within the current range of weekly settings.
Cumulative chick placements for the period January 4th through December 27th 2025 amounted to 10.00 billion chicks up approximately one percent from calendar 2024. Chick placements for 2026 to March 14th have attained 1.95 billion, up two percent from the corresponding period in 2025.
According to the March 23rd 2025 edition of USDA Chickens and Eggs, pullet breeder chicks hatched and intended for U.S. placement during February 2026 amounted to 9.06 million, up 10.1 percent (0.83 million pullet chicks) from February 2025. Broiler breeder hen complement attained 60.67 million on February 1st 2026, 2.0 percent (1.26 million hens) down from February 2025 but 7.3 percent (4.76 million hens) higher than January 2026.
 Broiler Production March 2026 Broiler Production March 2026
As documented in the March 26th 2026 USDA Weekly Poultry Slaughter Reports for the processing week ending March 21st 2026, 170.2 million broilers were processed at 6.50 lbs. live. This was 1.9 percent more than the 167.0 million processed during the corresponding week in March 2025. Broilers processed in 2026 to date amounted to 2,036 million, 3.7 percent more than the 1,964 million during the corresponding period in 2025.
Ready to cook (RTC) weight for the most recent week in March was 839.7 million lbs. (380,086 metric tons). This was 1.8 percent more than the 825.1 million lbs. during the corresponding week in March 2025. Dressing percentage was a nominal 76.0 percent. For 2026 to date RTC broiler production attained 10,137 million lbs. (4.597 million metric tons). This quantity was 3.3 percent more than for the corresponding period in 2025.
The USDA posted live-weight data for the past week ending March 21st and YTD 2026 including:-
|
Live Weight Range (lbs.)
|
<4.25
|
4.26-6.25
|
6.26-7.25
|
>7.76
|
|
Proportion past week (%)
|
15
|
29
|
28
|
29
|
|
Change from 2020 YTD (%)
|
-7
|
+3
|
+12
|
+3
|
February 2026 Frozen Inventory
According to the March 24th 2026 USDA Cold Storage Report, stocks of broiler products as of February 28th 2026 compared to February 28th 2025 showed differences with respect to the following categories:-
- Total Chicken category attained 780.1 million lbs. (353,798 metric tons) corresponding to approximately one week of production based on recent weekly RTC output. The February 28th 2026 inventory was down 1.7 percent compared to 793,487 million lbs. (359,858 metric tons) on February 28th 2025 and down 0.5 percent from the previous month of January 2026.
- Leg Quarters were down 19.4 percent to 48.8 million lbs. compared to February 28th 2025 consistent with the data on exports. Inventory was up 8.1 percent from January 2026. Given the trend in inventory of leg quarters it is evident that this category continues to be shipped in varying quantities as the principal (96 percent) chicken export product to a number of nations.
- The Breasts and Breast Meat category was down 7.5 percent from February 28th 2025 to 234.4 million lbs. indicating a relatively higher domestic consumer demand for this category possibly reflecting concern over inflation in the cost of alternative proteins. The February 28th 2026 stock level was 1.2 percent higher than January 31st 2026. The trend through 2025 and into 2026 suggests stable retail and food service demand for the white meat category. This is despite promotion of chicken sandwiches and wraps by QSRs in the face of a higher cost for beef coupled with an increasing pattern of eat-at-home consumption.
- Total inventory of dark meat (drumsticks legs, thighs and thigh quarters but excluding leg quarters) on February 28th 2026 decreased 3.5 percent from February 28th 2025 to 64.2 million lbs. This difference suggests an increase in domestic demand for lower-priced dark meat against the prevailing price of white chicken meat. Higher prices for competitive proteins offer an opportunity to increase domestic demand for this category with innovative product development and promotion.
- Wings showed a 1.5 percent decrease from February 28th 2025, contributing to a stock of 52.9 million lbs. Inventory of wings was 3.2 percent higher compared to the end of January 2026. Movement in stock over the past 12 months has demonstrated slightly higher demand for this category despite competition from “boneless wings.” Increased consumption traditionally associated with significant sports events including College bowls and the NFL Super Bowl traditionally reduce the volumes of storage in January through April. Unit price increased progressively during 2024 but plateaued in 2025 due to consumer fatigue and competition from competing protein snacks despite continued interest in professional and collegiate football.
- The inventory of Paws and Feet was 27.0 percent lower than on February 28th 2025 to 24.4 million lbs. Stock was 9.1 percent lower than on January 31st 2026. Prior to the April 2020 Phase-1 Trade Agreement approximately half of the shipments of paws and feet destined for Hong Kong were landed and transshipped to the Mainland, a trend that is re-emerging.
- The Other category comprising 333.0 million lbs. on February 28th 2026 was up 6.6 percent from February 28th 2025 but represented a substantial 42.7 percent of inventory. The high proportion of the Other category suggests further classification or re-allocation by USDA to the designated major categories.
February 2026 Processed Broiler Production
The monthly USDA Poultry Slaughter Report was released on March 27th covering February 2026. The month comprised 20 week-days, the same as February 2025. The following values were documented for the month of February 2026:-
- A total of 753.5 million broilers were processed in February 2026, up 22.4 million or 3.1 percent from February 2025;
- Total live weight in February 2026 attained 5,030 million lbs., up 223.0 million lbs. or 4.6 percent from February 2025;
- Unit live weight in February 2026 was 6.68 lbs., up 0.11lb. (1.7 percent) from February 2025.
- RTC in February 2026 attained 3,807 million lbs., up 173.5 million lbs. or 4.8 percent from February 2006.
- WOG yield in February 2026 was up an inconsequential 0.1 percent to 75.7 percent, from 75.6 percent in February 2025.
- The proportion marketed as chilled in February 2026 comprised 93.3 percent of RTC output, unchanged from February 2025.
- Ante-mortem condemnation as a proportion of live weight attained 0.19 percent during February 2026 down from 0.21 percent in February 2025.
- Post-mortem condemnations as a proportion of processed mass corresponded to 0.48 percent during February 2026, unchanged from February 2025.
Comments
Mexico has recognized the OIE principle of regionalization after intensive negotiations between SENASICA and the U.S. counterpart, USDA-APHIS assisted by USAPEEC. Provided importing nations adhere to OIE guidelines on regionalization, localized outbreaks of avian influenza or possibly Newcastle disease will affect exports only from states or counties with outbreaks in commercial flocks. The response of China, Japan and some other nations is less predictable with bans placed on a nationwide or statewide basis. The response by China to outbreaks is influenced more by self-interest than considerations of scientific fact or international trade obligations. Other importing nations have confined restrictions to counties following the WOAH principle of regionalization. The challenge facing the U.S. as the second largest exporting nation after Brazil, will be to gain acceptance for controlled vaccination against HPAI in specific industry sectors and regions with appropriate surveillance and certification to the satisfaction of importing nations.
|
U.S. Broiler and Turkey Exports, January 2026.
|
|
 OVERVIEW OVERVIEW
Total exports of bone-in broiler parts and feet during January 2026 attained 244,547 metric tons, 2.0 percent higher than in January 2025 (239,680 metric tons). Total value of broiler exports decreased by 5.1 percent to $349.9 million ($368.0 million).
Total export volume of turkey products during January 2026 attained 19,452 metric tons, 33.5 percent more than in January 2026 (14,561 metric tons). Total value of turkey exports increased by 76.1 percent to $91.6 million ($52.0 million).
Average unit price attained by the broiler industry is constrained by the fact that leg quarters comprise over 96 percent of broiler meat exports by volume (excluding feet). Leg quarters represent a relatively low-value undifferentiated commodity lacking in pricing power. Exporters of commodities are subjected to competition from domestic production in importing nations. Generic products such as leg quarters are vulnerable to trade disputes and embargos based on real or contrived disease restrictions. To increase sales volume and value the U.S. industry will have to become more customer-centric offering value-added presentations with attributes required by importers. Whether this will increase margins is questionable given that leg quarters are regarded by U.S. integrators as a by-product of broiler production. A more profitable long-term strategy for the U.S. industry would be to develop products using dark meat to compete with and displace pork and beef in the domestic retail and institutional markets. Due to a shortage and hence high price for beef products this opportunity is now evident.
HPAI is now accepted to be panornitic affecting the poultry meat industries of six continents with seasonal and sporadic outbreaks. The incidence rate and location of cases in the U.S. has limited the eligibility for export from many plants depending on restrictions imposed by importing nations. Incident cases in the U.S. continued at a high rate in egg-production flocks and in turkeys during late 2025 with a resurgence evident during the first quarter of 2026.
Uncertainty surrounding tariff policy is an added complication potentially impacting export volume in 2026. In the event of reduced exports, leg quarters would be diverted to the domestic market resulting in a depression in average value derived from a processed bird.
To offset an anticipated decline in exports of U.S. agricultural products the USDA will make available $285 million during 2026 for trade promotion including trade reciprocity missions and credit guarantees under the GSM-102 program. The USAPEEC received $7.0 million for export promotion for FY 2026. Of this total, $5.8 million was through the Market Access Program (MAP) and $1.2 million through the Foreign Market Development Program (FMDP). For FY 2026 The USDA will distribute $181 million among 68 industry associations under the MAP and $31 million under the FMDP to 18 organizations.
 EXPORT VOLUMES AND PRICES FOR BROILER MEAT 2025 EXPORT VOLUMES AND PRICES FOR BROILER MEAT 2025
For comparison, during 2025 the National Chicken Council (NCC), citing USDA-FAS data, documented exports of 3,171,206 metric tons of chicken parts and other forms (whole and prepared), down 3.8 percent from January-December 2024. Exports were valued at $4,764 million with a weighted average unit value of $1,503 per metric ton.
The NCC breakdown of chicken exports for 2025 by proportion and unit price for each category compared with the corresponding months in 2024 (with the unit price in parentheses) comprised:-
- Chicken parts (excluding feet) 1%; Unit value $1,395 per metric ton ($1,365)
- Prepared chicken 0%; Unit value $4,640 per metric ton ($4,244)
- Whole chicken 9%; Unit value $1,688 per metric ton ($1,755)
- Composite Total 0%; Av. value $1,503 per metric ton ($1,466)
EXPORT VOLUMES AND PRICES FOR BROILER MEAT JANUARY 2026
The following table prepared from USDA data circulated by the USAPEEC, compares values for poultry meat exports during January 2026 compared with the corresponding month during 2025:-
|
PRODUCT
|
January 2025
|
January 2026
|
DIFFERENCE
|
|
Broiler Meat & Feet
|
|
|
|
|
Volume (metric tons)
|
239,680
|
244,547
|
+4,867 (+2.6%)
|
|
Value ($ millions)
|
368.0
|
349.9
|
-18.1 (-4.9%)
|
|
Unit value ($/m. ton)
|
1,535
|
1,431
|
-104.0 (-6.8%)
|
|
Turkey Meat
|
|
|
|
|
Volume (metric tons)
|
14,561
|
19,452
|
+4,891 (+33.6%)
|
|
Value ($ millions)
|
52.0
|
91.6
|
+39.6 (+76.1%)
|
|
Unit value ($/m. ton)
|
3,571
|
4,709
|
+1,138 (+31.9%)
|
COMPARISON OF U.S. CHICKEN AND TURKEY EXPORTS
JANUARY 2026 COMPARED TO JANUARY 2025
BROILER EXPORTS
Total broiler parts, predominantly leg quarters but including feet, exported during January 2026 compared with the corresponding months in 2025 increased by 2.6 percent in volume but value was down 4.9 percent. Unit value was 6.8 percent lower to $1,431 per metric ton.
For comparison during 2024 exports of parts and feet attained 3,251,000 metric tons valued at $4,689 million, down 10.5 percent in volume and down 1.1 percent in value compared to 2023. Unit value was up 10.7 percent to $1,442 per metric ton
During 2025 exports attained 3,131,807 metric tons valued at $4,644 million, down 3.4 percent in volume and down 1.2 percent in value compared to 2024. Unit value was up 2.2 percent to $1,482 per metric ton
Broiler imports in 2025 are projected to attain an inconsequential 152.2 million lbs. (69,025 metric tons) compared to 82,000 metric tons (180,000 million lbs.) in 2024. Exporters to the U.S. in 2025 comprised Chile (78.4 percent of volume) and Canada (21.2 percent).
Projected imports for 2026 will be 132 million lbs. (59.900 metric tons)
The top five importers of broiler meat represented 47.3 percent of shipments during January 2026. The top ten importers comprised 67.4 percent of the total volume reflecting concentration among the significant importing nations.
First-ranked Mexico imported 56,948 metric tons in January representing 23.3 percent of shipments to our southern USMCA partner valued at $66.8 million with a unit price of $1,173 per metric ton. Volume and value were respectively 13.6 and 19.5 percent lower than for the corresponding month in 2025
Second-ranked Cuba imported 15,663 metric tons in January representing 6.4 percent of shipments that were valued at $19.4 million with a unit price of $1,219 per metric ton. Volume and value were respectively 40.2 and 43.2 percent lower than for the corresponding period in 2025. Continued trade with Cuba is imperiled by declining economic strength. Their capacity to import was recently exacerbated by the energy crisis resulting from loss of support by Venezuela and U.S. policy on the supply of fuel to the nation.
China declined to 12th in rank among importers by 29.0 percent in volume to 5,880 tons and concurrently by 46.0 percent in value to $16.5 million in January 2026 compared to the corresponding month in 2025. Unit value decreased by 24.0 percent to $2,806 per metric ton reflecting a high proportion of feet in consignments
Nations gaining in volume compared to the corresponding January 2025 (with the percentage change indicated) in descending order of volume with ranking indicated by numeral were:-
- Viet Nam, (+92%); 6. Guatemala, (+3%); 7. Philippines, (+97%); 8. Angola, (+71%); 9. Haiti, (+83%); 10, Turkmenistan., (+246%) and 14. Hong Kong, (+136%)
Losses during January 2026 offset the gains in exports with declines for:-
- Mexico, (-14%); 2. Cuba, (-40%); 3. Taiwan, (-31%); 5. Canada, (-9%);
- Dominican Republic, (-5%) and 12. China, (-29).
TURKEY EXPORTS
The volume of turkey meat exported during January 2026 increased by 33.6 percent to 19,452 metric tons compared to January 2025 with value 76.1 percent higher at $91.6 million. Average unit value was 31.9 percent higher at $4,709 per metric ton.
Imports of turkey products attained 15,000 metric tons (33 million lbs.) in 2024 with a similar projection for 2025.
Mexico imported 6,184 tons during January 2026 representing 76.4 percent of volume. Value attained $79 million comprising 86.2 percent of revenue at a unit price of $4,881 per ton.
During January, Guatemala imported 597 tons, Costa Rica 421 tons, Dominican Republic 269 tons collectively 1,287 tons representing 6.6 percent of exports of turkey products
Canada imported 297 tons (1.5 percent of exports) valued at $1.5 million with a unit price of $5,050 per ton.
It is important to recognize that exports of chicken and turkey meat products to our USMCA partners amounted to $1,264 million in 2021, $1,647 million during 2022, $1,696 in 2023 and close to $2,000 million during 2025. It will be necessary for all three parties to the USMCA to respect the terms of the Agreement in good faith since punitive action against Mexico or Canada on issues unrelated to poultry products will result in reciprocal action by our trading partners to the possible detriment of U.S. agriculture.
The emergence of H5N1strain avian influenza virus with a Eurasian genome in migratory waterfowl in all four Flyways of the U.S. during 2022 was responsible for sporadic outbreaks of avian influenza in backyard flocks and serious commercial losses in egg-producing complexes and turkey flocks but to a lesser extent in broilers. The probability of additional outbreaks of HPAI over succeeding weeks appears likely with recorded outbreaks in turkey farms in ND, SD and MN. Consistent with fall migration of waterfowl. Incident cases affecting egg-production and turkey flocks will be a function of shedding by migratory and domestic birds and possibly free-living mammals or even extension from dairy herds. Protection of commercial flocks at present relies on the intensity and efficiency of biosecurity including wild-bird laser repellant installations, representing investment in structural improvements and operational procedures. These measures are apparently inadequate to provide absolute protection, suggesting the need for preventive vaccination in high-risk areas for egg-producing, breeder and turkey flocks.
The application of restricted county-wide embargos following the limited and regional cases of HPAI in broilers with restoration of eligibility 28 days after decontamination has supported export volume for the U.S. broiler industry. Exports of turkey products were more constrained with plants processing turkeys in Minnesota, the Dakotas, Wisconsin and Iowa impacted. The future challenge will be to gain acceptance for limited preventive vaccination of laying hens and turkeys in high-risk areas accompanied by intensive surveillance. It is now accepted that H5N1 HPAI is panornitic in distribution among commercial and migratory birds across six continents. The infection is now seasonally or regionally endemic in many nations with intensive poultry production, suggesting that vaccination will have to be accepted among trading partners as an adjunct to control measures in accordance with WOAH policy.
The live-bird market system supplying metropolitan areas, the presence of numerous backyard flocks, gamefowl and commercial laying hens allowed outside access, potentially in contact with migratory and now some resident bird species, all represent an ongoing danger to the entire U.S. commercial industry. The live-bird segments of U.S. poultry production represent a risk to the export eligibility of the broiler and turkey industries notwithstanding WOAH compartmentalization for breeders and regionalization (zoning) to counties or states for commercial production.
|
Updated USDA-ERS March 2026 Poultry Meat Projection
|
|
 On March 16th 2026 the USDA-Economic Research Service released updated production and consumption data with respect to broilers and turkeys, covering actual 2024, a projection for 2025 and a forecast for 2026. On March 16th 2026 the USDA-Economic Research Service released updated production and consumption data with respect to broilers and turkeys, covering actual 2024, a projection for 2025 and a forecast for 2026.
The revised 2025 projection for broiler production was almost unchanged at 48,006 million lbs. (23.707 million metric tons) up 2.2 percent from 2024. USDA projected per capita consumption of 102.9 lbs. (45.7 kg.) for 2025, up 1.8 percent from 2024. Exports will attain 6,672 million lbs. (3.026 million metric tons), 0.1 percent below the previous year.
The 2026 USDA forecast for broiler production will be 48,700 million lbs. (22,086 million metric tons) up 1.4 percent from 2025 with per capita consumption up 1.4 percent to 104.3 lbs. (47.3 kg). Exports will be down by 0.1 percent compared to 2025 at 6,670 million lbs. (3.2946670 million metric tons), equivalent to 13.7 percent of production.
Production values for the broiler and turkey segments of the U.S. poultry meat industry are tabulated below:-
|
Parameter
|
2024
(actual)
|
2025
(projection)
|
2026
(forecast)
|
Difference
2024 to 2025
|
|
Broilers
|
|
|
|
|
|
Production (million lbs.)
|
46,995
|
48,006
|
48,700
|
+2.2
|
|
Consumption (lbs. per capita)
|
101.1
|
102.9
|
104.3
|
+1.8
|
|
Exports (million lbs.)
|
6,680
|
6,672
|
6,670
|
-0.3
|
|
Proportion of production (%)
|
14.2
|
13.9
|
13.7
|
-2.1
|
|
|
|
|
|
|
|
Turkeys
|
|
|
|
|
|
Production (million lbs.)
|
5,121
|
4,844
|
4,930
|
-5.4
|
|
Consumption (lbs. per capita)
|
13.8
|
13.2
|
13.3
|
-4.4
|
|
Exports (million lbs.)
|
486
|
425
|
400
|
-12.6
|
|
Proportion of production (%)
|
9.5
|
8.8
|
8.1
|
-9.5
|
Source: Livestock, Dairy and Poultry Outlook released March 16th 2026
 The March 16th USDA report updated the projection for the turkey industry during 2025 including annual production of 4,844 million lbs. (2.197 million metric tons), down 5.4 percent from 2024. Consumption in 2025 is projected to be 13.2 lbs. (6.0kg.) per capita, down by 4.4 percent from the previous year. Export volume will attain 425 million lbs. (192,744 metric tons) in 2025. Values for production and consumption of RTC turkey in 2025 and 2026 are considered to be realistic, given year to date data, the prevailing economy, variable weekly poult placements, trends in production levels, losses from HPAI and inventories consistent with season. The March 16th USDA report updated the projection for the turkey industry during 2025 including annual production of 4,844 million lbs. (2.197 million metric tons), down 5.4 percent from 2024. Consumption in 2025 is projected to be 13.2 lbs. (6.0kg.) per capita, down by 4.4 percent from the previous year. Export volume will attain 425 million lbs. (192,744 metric tons) in 2025. Values for production and consumption of RTC turkey in 2025 and 2026 are considered to be realistic, given year to date data, the prevailing economy, variable weekly poult placements, trends in production levels, losses from HPAI and inventories consistent with season.
The 2026 forecast for turkey production is 4,930 million lbs. (2.236 million metric tons) up an optimistic 1.8 percent from 2025 with per capita consumption up 0.8 percent to 13.3 lbs. (6.0 kg). Exports will be 5.9 percent lower than in 2025 to 400 million lbs. (181,406 metric tons) equivalent to 8.1 percent of production. This implies a reduction in selling prices for whole birds and products
Export projections do not allow for a breakdown in trade relations with existing major partners including Mexico, Canada and China nor the impact of catastrophic diseases including HPAI and vvND in either the U.S. or importing nations
|
Broiler Production and Exports from Brazil, 2026
|
|
 According to the March 10th release of USDA GAIN Report PR2026-12, broiler production in Brazil will increase in 2026 by 1.6 percent over 2025 to 15,700 million metric tons. Brazil will export 5,150 million metric tons, a decline of 1.9 percent from 2025, but representing 32.8 percent of RTC production. Domestic offtake will increase by 0.7 percent to 10,555 million metric tons, representing a per capita consumption value of 49.6 kg. (109 lbs.) assuming a population of 213 million. According to the March 10th release of USDA GAIN Report PR2026-12, broiler production in Brazil will increase in 2026 by 1.6 percent over 2025 to 15,700 million metric tons. Brazil will export 5,150 million metric tons, a decline of 1.9 percent from 2025, but representing 32.8 percent of RTC production. Domestic offtake will increase by 0.7 percent to 10,555 million metric tons, representing a per capita consumption value of 49.6 kg. (109 lbs.) assuming a population of 213 million.

In reviewing production costs in Brazil, the following proportions were assigned by GAIN representatives in Brazil:
|
Component
|
Proportion (%)
|
|
Overhead
|
8.2
|
|
Feed
|
63.3
|
|
Chicks
|
19.0
|
|
Labor
|
4.5
|
|
Consumables
|
1.1
|
|
Utilities
|
2.5
|
|
Transport
|
1.4
|
|
Total
|
100
|
The report indicates a production cost in Parana state of $US 0.40 per lb. (4.7R$/kg.).
|
Ag Groups Urge Continued U.S. Participation in WTO
|
|
 Despite the prevailing policy of the current Administration to reject participation in international organizations, the U.S. Agriculture Coalition for WTO Reform has urged continued membership. The Coalition includes the USA Poultry and Egg Export Council (USAPEEC), the National Pork Producers Council (NPPC) and other organizations representing agricultural commodities. Despite the prevailing policy of the current Administration to reject participation in international organizations, the U.S. Agriculture Coalition for WTO Reform has urged continued membership. The Coalition includes the USA Poultry and Egg Export Council (USAPEEC), the National Pork Producers Council (NPPC) and other organizations representing agricultural commodities.
As with many international organizations, required changes require prolonged discussion, review and in some cases blatant obstruction as is the situation with the WTO comprising 164 member countries. Notwithstanding obstacles, the United States Trade Representative, Ambassador Jamieson Greer, has made 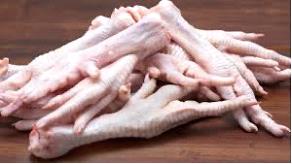 some progress through bilateral workarounds “superseding WTO commitments including a lift of trade barriers that are in violation of WTO rules”. Areas of concern include unnecessary phytosanitary requirements and delayed registration of establishments. some progress through bilateral workarounds “superseding WTO commitments including a lift of trade barriers that are in violation of WTO rules”. Areas of concern include unnecessary phytosanitary requirements and delayed registration of establishments.
The Coalition considers that an active U.S. involvement in the WTO can support bilateral trade agreements that are favored by the President. The NPPC noted that, “U.S. engagement with the leadership among the WTO membership is essential to U.S. agricultural interests.”
In the letter addressed to the USDA Under Secretary for Trade and Foreign Agricultural Affairs, the Coalition urges support for the WTO as “The agreement provides more predictable market access and results in reduced trade distortions in agricultural markets.”
|
AgriStats Antitrust Trial to Proceed
|
|

U.S. District Judge, John R. Tunheim, has ruled that the bench trial of the action brought by the Federal Trade Commission and six states will begin on May 4th. The Defendant, AgriStats had argued that proceeding with the trial before a scheduled civil antitrust lawsuit would be prejudicial and would violate the Seventh Amendment rights of the company. This contention was rejected by Judge Tunheim based on a Supreme Court precedent. The presiding judge also invoked the Sherman Antitrust Act requiring courts to proceed “as soon as possible in government enforcement actions” and that to delay “would not serve the interest of justice”.

In United States v. AgriStats, the FTC and the states of California, North Carolina, Tennessee, Minnesota, Texas and Utah allege that the company “engaged in an unlawful information-sharing conspiracy with major broiler, chicken, turkey and pork processors”.
To date, the Co-Defendants represented by broiler and turkey integrators and pork packers have settled with Plaintiffs leaving AgriStats as the only Defendant.
|
USDA Delays Poultry Grower Payment Rule
|
|
 The USDA has announced that the Biden-era Poultry Grower Payment Rule will be delayed until December 31st, 2027. The Agricultural Marketing Service requires the delay to consider the estimated cost and policy issues involved. The USDA has announced that the Biden-era Poultry Grower Payment Rule will be delayed until December 31st, 2027. The Agricultural Marketing Service requires the delay to consider the estimated cost and policy issues involved.
The intent of the amendment under the Packers and Stockyards Act, finalized on January 16th, 2025, would have prohibited live poultry integrators from reducing a grower’s compensation based on tournament-rankings. The regulations would have required integrators to allow “fair compensation” and require additional disclosures, especially in relation to upgrades requiring capital investment.
Delaying the rule would apparently save integrators and contractors approximately $5 million in administrative costs over the first year.
Predictably, the delay in implementation of the Rule was supported by the National Chicken Council with Harrison Kircher, president of the Council, stating, “We applaud Secretary Rollins and the Trump Administration for their thoughtful review of this Biden-era regulation and for listening to chicken farmers across the country who oppose it.”
According to the NCC, the Rule would have been disruptive and “undermine a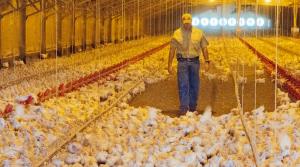 longstanding performance-based compensation model”. In addition, the Rule could potentially have limited bonuses for the most productive contractors. longstanding performance-based compensation model”. In addition, the Rule could potentially have limited bonuses for the most productive contractors.
Any delay or recission of an onerous regulation that adds to the cost of production is considered appropriate since higher costs are invariably passed on to consumers or result in reduced domestic offtake and exports.
|
Producer Price and Consumer Price Indices Edge Up in February
|
|
According to a March 18th release by the Bureau of Labor Statistics, the Producer Price Index (PPI) increased by 0.5 percent in February, coming in above the 0.3 percent expectation. On a 12-month basis PPI was higher by 3.4 percent. Core PPI inflation (excluding, now very volatile energy and food was at 3.9 percent. Food prices increased by 2.4 percent.

The March 18th PPI followed the Department of Commerce Consumer Price Index CPI) that rose 2.8 percent year-over-year for the headline and 3.1 percent for the Core Index.
The seasonally adjusted one-month changes from January to February among food items included:- processed chicken (1.6 percent); turkeys (0.1 percent); dairy products( 0.6 percent); beef and veal (1.8 percent) with pork the highest at 2.6 percent. Beef and veal increased 13 percent year-over-year with a 7.9 percent increase in the third quarter of 2025, moderating in the fourth quarter but edging up in February.

The situation for eggs reflected wide swings that cannot be attributed to flock losses as a result of HPAI or demand. From December to January, eggs declined by 63.9 percent but from January to February increased by 93.6 percent. The annual February 2025 to February 2026 change was a decline of 80.4 percent.
|
The Meat Institute Opposes Family Grocery and Farmer Relief Act
|
|
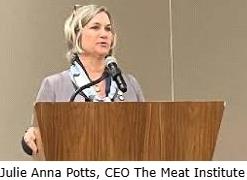 Following release of proposed legislation entitled the Family Grocery and Farmer Relief Act, The Meat Institute reacted characterizing the proposal “as absurd”. Julie Anna Potts, CEO of the organization, observes that the proposal championed by Chuck Schumer, Senate Minority Leader would have negligible impact on retail meat price but would disrupt the industry. Following release of proposed legislation entitled the Family Grocery and Farmer Relief Act, The Meat Institute reacted characterizing the proposal “as absurd”. Julie Anna Potts, CEO of the organization, observes that the proposal championed by Chuck Schumer, Senate Minority Leader would have negligible impact on retail meat price but would disrupt the industry.
If the packers of beef are acting in collusion to the detriment of feeders why are they losing money on every head? Mack Graves cites The Beef Industry Profit Tracker that documented a progressive loss for packers over 2024 through 2026 (to date) ranging from $75 to $205 per head. These figures are consistent with quarterly financial reports posted by Tyson Foods Inc. In contrast cow/calf operators have benefitted from increased margins ($114 to $1,123 per head) and the Feeders, intermediates in the production chain, ranged from a positive margin of $114 to $157 per head)
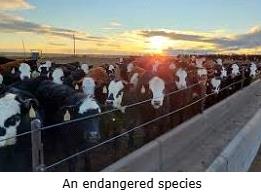
It is obvious to politicians and consumers alike that the price of red meat is unacceptably high. This is due to a disparity between supply and demand. Cattle inventories are at their lowest level for seven decades, attributed to drought, cold winters and financial pressures on ranchers and feedlot operators. Importation has been curtailed by inappropriate and erratic imposition of tariffs. Availability has been impacted more recently by intermittent and now prolonged closures of the Southern border as a result of outbreaks of New World screwworm in Mexico.
 Forcing the major red meat packers to divest operations would disrupt the supply chain, inhibit investment and expansion and would be antithetical to efficiency and low cost. Mandating that the major producers fragment their businesses would deny packers the economies of scale and indirectly lead to even higher prices. When politicians and bureaucrats contrive to “fix” a problem, unintended consequences emerge, requiring reversals and a restoration to the status quo. The proposed break-up of red-meat processors would represent a slippery slope ultimately impacting broiler integrations. Forcing the major red meat packers to divest operations would disrupt the supply chain, inhibit investment and expansion and would be antithetical to efficiency and low cost. Mandating that the major producers fragment their businesses would deny packers the economies of scale and indirectly lead to even higher prices. When politicians and bureaucrats contrive to “fix” a problem, unintended consequences emerge, requiring reversals and a restoration to the status quo. The proposed break-up of red-meat processors would represent a slippery slope ultimately impacting broiler integrations.
|
Costco Wholesale Corporation Posts Q2 FY 2026 Results
|
|
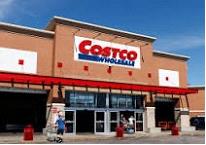 On May 3rd Costco Wholesale Corporation (COST) posted results for Q2 FY 2026 ending February 15th 2026 exceeding consensus estimates on EPS. On May 3rd Costco Wholesale Corporation (COST) posted results for Q2 FY 2026 ending February 15th 2026 exceeding consensus estimates on EPS.
For Q2 Costco reported earnings of $2,035 million on revenue (sales and membership fees) of $69,597 million with a diluted EPS of $0.84. For the corresponding Q2 of FY 2025, Costco earned $1,788 million on revenue of $63,723 million with a diluted EPS of $4.02. Comparing Q2 of 2026 with the corresponding quarter of FY 2025, sales were 9.2 percent higher; Gross margin increased from 10.8 percent for Q2 FY 2025 to 11.2 percent for the most recent quarter. Operating margin increased from 8.9 percent in Q2 2025 to 9.0 percent for Q2 FY 2026.
Revenue YTD for 2026 was $136,924 up 8.8 percent over the corresponding 24-week period in 2025. Adjusted comparable sales for the 26 weeks ending March 1st were 6.4 percent for the entire Company, with the U.S. at 6.1; Canada at 8.2 and Other International at 6.4 percent. Digital sales were up by 21.3 percent. Overall comparable same-store sales were up 6.7 percent attributed to increases of 3.1 percent in traffic and 3.5 percent in ticket value.
Issues reviewed at the Investors’ Call included the impact and legality of erratic and unpredictable tariffs. According to Ron Vachris CEO, one third of the 4,000 SKUs are imported. Costco management will do all possible to restrain price increases and to possibly reimburse customers should this be practical or achievable. The Company is upgrading checkout procedures to enhance customer satisfaction.

Worldwide Costco posted an 89.7 percent membership renewal rate and a 4.8 percent increase in total membership to 82.1 million.
On February 15th 2026 Costco posted total assets of $83,639 million. Long-term debt and lease obligations amounted to $10,789 million.
Costco had an intraday market capitalization of $442,520 million on March 11th 2026. The Company has traded over the past fifty-two weeks over a range of $844.06 to $1,067.08 with a 50-day moving average of $967.08. COST trades with a forward P/E of 49.0. On March 3rd 2026 COST closed at $1,006.71 pre-release but traded at a low of $958.03 at noon post-release recovering to $990.48 at the close on March 11th.
 Twelve-month trailing operating margin was 3.7 percent and profit margin 3.0 percent. The Company generated a return on assets of 8.7 percent and 29.7 percent on equity Twelve-month trailing operating margin was 3.7 percent and profit margin 3.0 percent. The Company generated a return on assets of 8.7 percent and 29.7 percent on equity
Costco operates 924 warehouses with 624 in the U.S., 114 in Canada, 42 in Mexico and the remainder in 11 nations. Expansion plans are for 30 additional warehouses worldwide annually over the proximal five years.
|
JBS Workers Strike at Greeley, CO. Beef Plant
|
|
 On Monday, March 16th, union workers at the JBS Greeley, beef plant launched a strike with wages and working conditions as major issues of contention. The United Food and Commercial Workers, Local 7, represents close to 4,000 employees at the plant. The Company and the Union have yet to resolve include increased line speeds to 420 cattle per hour, wage rates, safety and reimbursement for protective equipment. On Monday, March 16th, union workers at the JBS Greeley, beef plant launched a strike with wages and working conditions as major issues of contention. The United Food and Commercial Workers, Local 7, represents close to 4,000 employees at the plant. The Company and the Union have yet to resolve include increased line speeds to 420 cattle per hour, wage rates, safety and reimbursement for protective equipment.

Kim Cordova, president of the UFCW, Local 7, noted, “This is an historic moment in time to see workers come out like this”. The Union has filed complaints with the National Labor Relations Board alleging changes to working conditions contrary to the existing contract.
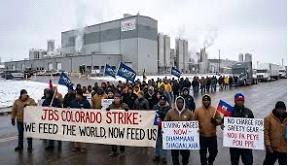
Negotiations to establish a new contract have been ongoing since August 2025 without agreement on the major issues of wages and safety.
The UFCW is in a weak bargaining position given the spare packing capacity within JBS and among competitors. The Company will dig-in for a protracted strike to weaken the Union and reduce future labor costs. This is supported by increased packing margins now above breakeven.
|
Geopolitical Considerations from Iran Conflict
|
|
 The most significant impact from the ongoing conflict with Iran will be the fallout from the closure of the Strait of Hormuz. Most commentators anticipate the potential duration of obstruction to passage to extend to a few weeks. This predictable cessation of free navigation will have profound consequences to energy, The most significant impact from the ongoing conflict with Iran will be the fallout from the closure of the Strait of Hormuz. Most commentators anticipate the potential duration of obstruction to passage to extend to a few weeks. This predictable cessation of free navigation will have profound consequences to energy,  fertilizer and aluminum markets. There is a likelihood that with a prolonged war, Houthi rebels, a surrogate of Iran, may impede transit through the Red Sea at the southern chokepoint of Bab-el-Mandep. fertilizer and aluminum markets. There is a likelihood that with a prolonged war, Houthi rebels, a surrogate of Iran, may impede transit through the Red Sea at the southern chokepoint of Bab-el-Mandep.
A sharp rise in the price of gasoline and diesel fuel is an immediate result of the conflict and will raise production costs for agriculture and industry. Since China is impacted, this nation may respond with sanctions on imports from the U.S. The postponement of the meeting between Presidents Trump and Xi presages further trade complications. Bilateral diplomacy may be necessary to moderate the prevailing opinion that the U.S. initiated the war with a deleterious impact on China.
If exports of soybeans and corn from the U.S. are curtailed or cancelled, prices  will fall benefitting livestock producers at the expense of row-crop farmers. Predictably the government will come to their rescue at a cost to taxpayers and adding to the burgeoning national debt. will fall benefitting livestock producers at the expense of row-crop farmers. Predictably the government will come to their rescue at a cost to taxpayers and adding to the burgeoning national debt.
The quicker that free passage through the Strait of Hormuz is restored, the quicker the agricultural economy will return to the predicted pattern of costs, prices and export volumes for 2026.
|
Beyond Meat Inc. Facing NASDAQ De-listing
|
|
 Beyond Meat has received a warning letter from the NASDAQ Stock Exchange involving mandatory delisting because the stock price has fallen below $1.00 for more than 30 days. A final decision on de-listing will be made on August 31st. To comply with NASDAQ rules, closing bid prices must exceed $1.00 for 10 days. Beyond Meat has been listed since May 2nd 2019 attaining a peak market capitalization of $14 billion and a stock price of $235 in mid-July 2019. Beyond Meat has received a warning letter from the NASDAQ Stock Exchange involving mandatory delisting because the stock price has fallen below $1.00 for more than 30 days. A final decision on de-listing will be made on August 31st. To comply with NASDAQ rules, closing bid prices must exceed $1.00 for 10 days. Beyond Meat has been listed since May 2nd 2019 attaining a peak market capitalization of $14 billion and a stock price of $235 in mid-July 2019.
The company has been unsuccessful in averting a prolonged decline in sales. On November 10, 2025, Beyond Meat reported on the quarter ending September 27th, posting a loss of $111 million on sales of $70.2 million with a negative EPS of $1.44. This compares with the corresponding quarter of 2024 with a loss of $27 million on sales of $81 million and a negative EPS of $0.41. The 13 percent decline in sales indicates lack of demand for the company’s vegetable-based meat substitute despite changes in packaging and pricing.
On March 16th, Beyond Meat, Inc. announced a delay in the publication of Q4 and Fiscal 2025 results. The company cited “internal control issues related to inventory”. In the recent company statement, the annual report for FY 2025 should be filed by March 31, 2026, but the company stated that additional delays may be announced due to “material weakness” in internal controls over reporting. It is anticipated that the company will report a 16 percent decline in FY 2025 revenue from $326 million to $275 million.

Currently Beyond Meat carries $1,320 million in long-term debt with an accumulated deficit of $1,434 million. In the November 10th Q3 filing, inventory was valued at $110.3 million, representing 40 percent of the projected FY 2025 revenue.
For the past 12 months, BYND shares have fallen from a high of $7.69 to $0.50 with a 50-day moving average of $0.82. The stock closed on March 17th at $0.75. Thirty-two percent of the float was short on February 27
Beyond Meat has had a market capitalization of $367 million on March 17th. Twelve-month trailing profit margin was -81 percent with an operating margin of -47 percent.
The statement by the Chairman accompanying the Q3 results represented yet again an unsubstantiated stream of optimism, disconnected from the current financial predicament. This is attributed to lack of demand for a product that is in reality more expensive and inferior to real meat. In addition margins have been impacted by mismanagement and failure to control costs.
The end for this Company is nigh and it will not be pretty for shareholders and investors with no White Knights on the horizon.
|
McDonald’s Anticipates “Challenging Future”
|
|
During the McDonald’s Corp. earnings call, Chris Kempczinski, CEO, emphasized the need for the company to apply discounts and feature value meals. McDonald’s will launch a new value menu in April featuring a 4-piece chicken McNuggets priced at $3 (75 cents a pop?) and a breakfast bundle including a McMuffin, hash brown and coffee for $4.

It is not expected that McDonald’s will sweep the QSR market with their value meals since competitors Wendy’s, Burger King and Taco Bell are also offering value promotions. This confirms that price as a restraint to traffic, especially among the lower- and middle-income demographics.
Fortune cited a Pew research survey finding 72 percent of consumers regard economic conditions as ‘fair’ or ‘poor’ and 40 percent express a pessimistic view for the future.
Over FY 2025 ending December 31st, McDonald’s earned $8,563 million on revenue of $26,855 million with a diluted EPS of $11.95. Comparable figures for FY 2024 were net earnings of $8,223 million on revenues of $25,920 million with a diluted EPS of $11.39.
McDonald’s posted a global comparable sales increase of 3.1 percent for FY 2025 with the U.S. attaining 2.1 percent.

On December 31st, 2025, McDonald’s had assets of $59,515 million with long-term debt and lease obligations of $55,908 million. On March 16th, market cap was $232,630 million compared to $223,350 million on March 31st, 2025. The 52-week range in share price was $283.47 to $341.25 with a 50-day moving average of $320.68. Forward P/E is 27.3. On a 12-month training basis, operating margin was 45.0 percent and profit margin 31.9 percent.
The introduction of value meals will place McDonald’s and burger-centric QSRs in direct competition with chicken chains including Chick-fil-A and Popeye’s Louisiana Kitchen among others, that have the advantage of lower cost for a chicken filet compared to a ground beef patty.
|
AgriStats Settles with Plaintiffs in Civil Cases
|
|
 AgriStats, Inc. has reached settlement in numerous civil cases alleging collusion with broiler integrators and pork packers to the detriment of direct and indirect purchasers of meat and poultry. Terms have not been disclosed. Previously, meat-packer and poultry integrators (Defendants) settled with various Plaintiff classes including in the turkey AgriStats, Inc. has reached settlement in numerous civil cases alleging collusion with broiler integrators and pork packers to the detriment of direct and indirect purchasers of meat and poultry. Terms have not been disclosed. Previously, meat-packer and poultry integrators (Defendants) settled with various Plaintiff classes including in the turkey antitrust litigation and parallel pork and broiler claims. antitrust litigation and parallel pork and broiler claims.
Agreement for the negotiated settlements have yet to be approved by courts. End-use consumer Plaintiffs in the broiler case will file for a limited remand from the U.S. Court of Appeals for the 7th Circuit.
 The announced settlement of civil cases is separate from the federal antitrust case that will proceed to trial on May 4th. The announced settlement of civil cases is separate from the federal antitrust case that will proceed to trial on May 4th.
|
USDA to Erect Screwworm Fly Irradiation Facility
|
|
According to Brooke Rollins, Secretary of the USDA, the irradiation plant to propagate sterile male New World screwworm Cochliomyia hominivorax (NWS) flies will be located once again on the Moore Airbase with a projected ultimate completion date in November 2027. Initially, the plant will produce 100 million sterile flies each week. The capacity will subsequently be expanded to  achieve an output of 300 million sterile flies weekly. USDA produces 100 million sterile flies per week at a facility in Panama for dispersal in affected areas in Mexico. In the short term, USDA will provide $21 million to renovate and convert an existing irradiation facility designed to suppress fruit flies to NWS and to double production. This facility will be operated by the Commission for the Eradication and Prevention of Screwworm (COPEG) and will commence production during the summer of 2026. achieve an output of 300 million sterile flies weekly. USDA produces 100 million sterile flies per week at a facility in Panama for dispersal in affected areas in Mexico. In the short term, USDA will provide $21 million to renovate and convert an existing irradiation facility designed to suppress fruit flies to NWS and to double production. This facility will be operated by the Commission for the Eradication and Prevention of Screwworm (COPEG) and will commence production during the summer of 2026.
The Moore Airbase plant will be designed and erected by the Army Corp of Engineers and will allow the U.S. to be independent of supplies of sterile male screw worm flies from Central America and Mexico.
Although screw worm infestation was suppressed to the point of eradication in the U.S. by 1966 through dispersal of sterile male flies and from North America extending from the Panama Canal to the Southern U.S. border by the late 1990s.
Nature is resilient and infestation emerged in Guatemala in 2024 and spread to Mexico. This represents a threat to U.S. livestock and wildlife. The USDA-ERS estimate that the emergence of NWS in Texas would have cost the beef industry $1.9 billion in 2024.
The reemergence of New World screwworm indicates the need for widescale deployment of sterile male NWS flies. This will require close cooperation with neighboring nations to detect and eradicate the pest. Reintroduction into “cleared” regions is inevitable requiring surveillance and control over movement of livestock. Collectively regulators in Guatemala and Mexico missed the infestation and allowed spread by both movement of cattle and migration of flies.
The effect of border closure on availability of slaughter stock and the effect on the domestic price of beef has resulted in a reconsideration of the ban on importation of live cattle. We have witnessed deficiencies in the control of ticks at border crossings. It is hoped that USDA-FSIS will be able to manage inspection given the risks and consequences of introduction of Cochliomyia larvae into the U.S. Political expediency should not dictate decisions on pest and disease control
|
Conagra Brands to Extend Arkansas Plant
|
|
Conagra brands will commit $200 million to expand their manufacturing facility in Fayetteville, AR. The Arkansas Economic Development Commission announced the project on March 6th with construction to begin in the fourth quarter. The plant produces ready-to-eat products under the Hungry-Man, Banquet, Healthy Choice brands. The expansion will take place over a number of years and will create over 100 new positions.
Craig Weiss, Senior Vice-President of Supply Chain at Conagra Brands stated, “This significant investment in our Fayetteville facility will allow us to continue to grow our leading frozen foods business.”
Clint O’ Neal, Executive Director of the Arkansas Economic Development Commission, stated, “Conagra has been a valued member of the Arkansas business community for years and the company is doubling down on our state with the expansion in Fayetteville.
|
 |
|
Concern Over Oklahoma Environmental Litigation
|
|
 The two decades-long litigation over alleged pollution by major broiler integrators in the Illinois River watershed has led to preliminary settlements that have yet to be approved. To date, Peterson Farms, George’s, Inc., Tyson Foods, Inc. and Cargill, Inc. have agreed to settle with the State Attorney General, Gentner Drummond. Oklahoma has yet to negotiate a settlement with Cal-Maine Foods, an egg producer and Simmons Foods, a broiler integrator. The two decades-long litigation over alleged pollution by major broiler integrators in the Illinois River watershed has led to preliminary settlements that have yet to be approved. To date, Peterson Farms, George’s, Inc., Tyson Foods, Inc. and Cargill, Inc. have agreed to settle with the State Attorney General, Gentner Drummond. Oklahoma has yet to negotiate a settlement with Cal-Maine Foods, an egg producer and Simmons Foods, a broiler integrator.
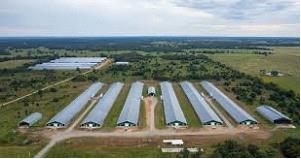
U.S. Federal District Judge Gregory. Frizzell has raised issues with the proposed settlement relating to Oklahoma v. Tyson Foods, Inc. over long-term implications for disposal of waste. Litter application by existing contractors would be subject to declining increments down to 20 percent of present volume over five succeeding years. The possibility of additional contractors and increased volumes of production in the watershed could negate the beneficial environmental effects of the settlement. If Judge Frizzell refuses to sanction the settlement agreements the co-defendants have signaled their intention to resort to the 10th Circuit Court of Appeals

Blayne Arthur the Secretary of the Oklahoma State Department of Agriculture and Jeff Starling Secretary of the Department of Energy and Environment have questioned the proposed settlement. Negotiations were initiated in 2005 by then Attorney General Drew Edmonds after a federal judge ruled that the eleven poultry companies were responsible for phosphorus pollution in the Illinois river watershed. The Secretaries have urged scrutiny of the proposed settlements they characterize as “imbalanced”. In their comments, the Secretaries consider that the settlement would result in a “fragmented regulatory landscape in which companies competing in the same market operate under dramatically different rules”. The proposed settlement also allows the Oklahoma Attorney General, to decide on payments without recourse to the Legislature.
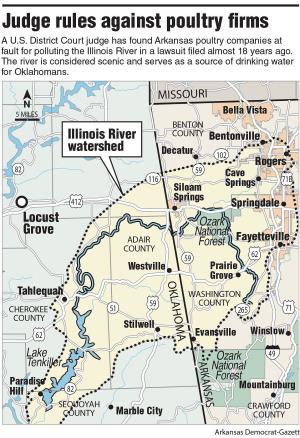
Disposal of poultry waste previously applied to agricultural land will be subject to increased regulation given the potential for eutrophication from phosphorus runoff into waterways suggesting alternative methods of disposal or pre-treatment before application.
Expedient resolution of the impasse is important since Tyson Foods will not place chicks with contractors operating in the Illinois River watershed until a settlement is finalized.
|
Conflict Over EID Tags for Livestock Continues
|
|
 Groups representing ranchers including the New Civil Liberties Alliance and R-Calf USA are embroiled in litigation with the USDA over electronic identification (EID) ear tags for cattle to be transported over state lines. Resistance to adoption has persisted for a number of years since USDA required EID ear tags in place of less expensive visual tags. The argument that EID tags are a financial burden should be viewed against the 2026 estimated margin of $1,123 per head accruing to cow/calf ranchers as estimated by the Beef Industry Profit Tracker. Groups representing ranchers including the New Civil Liberties Alliance and R-Calf USA are embroiled in litigation with the USDA over electronic identification (EID) ear tags for cattle to be transported over state lines. Resistance to adoption has persisted for a number of years since USDA required EID ear tags in place of less expensive visual tags. The argument that EID tags are a financial burden should be viewed against the 2026 estimated margin of $1,123 per head accruing to cow/calf ranchers as estimated by the Beef Industry Profit Tracker.
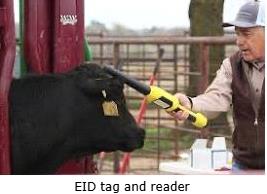 The USDA maintains that the EID tags are necessary to reduce errors in livestock tracking, critical to control of disease. This is especially important given the emergence of New World screwworm infestation in Mexico. Without a durable ID and tracking system the export market might be placed in jeopardy in the event of an extensive disease outbreak. The USDA maintains that the EID tags are necessary to reduce errors in livestock tracking, critical to control of disease. This is especially important given the emergence of New World screwworm infestation in Mexico. Without a durable ID and tracking system the export market might be placed in jeopardy in the event of an extensive disease outbreak.
Essentially EID tags reflect progress in the control of livestock disease and are superior in preventing fraud and illegality that could occur with the visual-only tags.
 The ear tag issue has become a question of “rights” representing opposition to state and federal mandates and regulations that are intended to improve livestock and human health. The growing “rights” movement is exemplified by passage of hastily enacted state laws and local ordinances allowing the distribution of raw milk, parental involvement in school curriculums and vaccination. The ear tag issue has become a question of “rights” representing opposition to state and federal mandates and regulations that are intended to improve livestock and human health. The growing “rights” movement is exemplified by passage of hastily enacted state laws and local ordinances allowing the distribution of raw milk, parental involvement in school curriculums and vaccination.
|
Impact of Closure of Tyson Foods Beef Plant in Lexington, NE.
|
|
In a move to reduce losses and facing the reality of a prolonged shortage of slaughter stock, Tyson Foods commenced layoffs in January 2026 at the Lexington, NE. beef plant that has been shuttered.

The University of Nebraska-Lincoln has calculated that closing the Lexington plant would have an annual state-wide impact of $3.3 billion. The plant had a nominal capacity of 5,000 head per day, representing close to five percent of total throughput. The plant closure will result in a loss of 3,000 jobs in a community of 11,000 suggesting a serious disruption in the affected town and surrounding Dawson County.
 Over the past three years, beef packers have experienced losses extending from $75 per head in 2024 to $205 per head predicted for 2026. It is a matter of record that Tyson Foods is attempting to rationalize their beef business by ‘right-sizing” a euphemism for terminating unprofitable plants and facilities. For Q1 FY 2026 their Beef Segment posted a GAAP loss of $319 million on sales of $5,771. In contrast the Chicken Segment generated an operating profit of $450 on sales of $4,212 million. Over the past three years, beef packers have experienced losses extending from $75 per head in 2024 to $205 per head predicted for 2026. It is a matter of record that Tyson Foods is attempting to rationalize their beef business by ‘right-sizing” a euphemism for terminating unprofitable plants and facilities. For Q1 FY 2026 their Beef Segment posted a GAAP loss of $319 million on sales of $5,771. In contrast the Chicken Segment generated an operating profit of $450 on sales of $4,212 million.
The U.S. Department of Labor announced in mid-March that $1.6 million would be awarded to the Nebraska Department of Labor for training services and expenses involved in reemployment for displaced workers. Funding was provided through the Workforce Innovation and Opportunity Act of 2014.
Tyson had every opportunity to predict the decrease in the number of animals available and could have initiated contingency plans dictated by the adverse operating environment. It is not unreasonable to expect that Tyson Foods should be responsible for relocation of employees, retraining and other direct expenses incurred by terminated employees and the State of Nebraska.
Given the beef cycle and the reduction in the cow-calf herd, it will be three years before there is any increase in availability of slaughter stock and the impact of the multi-year progressive decline in the breeding herd due to drought, competition from imports and inflation of the multi-year progressive decline in the breeding herd due to drought, competition from imports and inflation
|
Legislation to Ban Vertical Integration in Meat Packing
|
|
 Legislation has been introduced in Minnesota (HF4080) and Iowa (HF2734) to ban vertical integration in meat packing and to require “large” retailers from owning an interest in meat packing plants. The motivation for this legislation is questioned. The initiatives may simply to reflect “feel good” lawmaking confirm that individual state representatives are supporting constituents in advance of the mid-terms. Legislation has been introduced in Minnesota (HF4080) and Iowa (HF2734) to ban vertical integration in meat packing and to require “large” retailers from owning an interest in meat packing plants. The motivation for this legislation is questioned. The initiatives may simply to reflect “feel good” lawmaking confirm that individual state representatives are supporting constituents in advance of the mid-terms.
Predictably, the United Food and Commercial Workers International Union support the two initiatives. Mark Lauritsen, Director of Food Processing, Packing and Manufacturing Division for UFCW, stated, “When grocery retailers vertically integrate, we all suffer – workers, farmers, ranchers and consumers.” He continued, “For decades the Federal Trade Commission, the Justice Department (sic) and the USDA have failed to enforce anti-trust laws against dominant retailers.”

It would be interesting to review an impartial evaluation of the impact of investment by retailers in meat packers – if a substantial current reality. Naturally, the UFCW would be opposed to strong and profitable meat-packing companies since this would curb their bargaining power.
As a matter of record, packers have endured losses over the past three years. According to the Beef Industry Profit Tracker, losses in 2024 were $75 per head, rising to $131 in 2025 and in 2026, a negative margin of $205 per head is projected.
In Q1 2026, Tyson Foods posted a $319 million operating loss on beef sales of $5,771 million.

Over recent weeks, packer margin for the 7-day period ending March 14 estimated a loss of $55 per head, an improvement on the previous month. The benefit enjoyed by packers was at the expense of feedlot operators experiencing a loss of $49 per head. It is estimated that in 2026, feedlot operators and other feeders would generate a positive margin of $155 per head.
|
Proposal to Review Impact of Consolidation in Meat Processing
|
|
 The Livestock Consolidation Research Act has been introduced into Congress by Senators Chuck Grassley (R-IA) and Tina Smith (D-MN). The intent of the legislation would be to direct the USDA Economic Research Service to analyze whether concentration in beef packing impacts farmers, ranchers and ultimately, retail prices to consumers. The Livestock Consolidation Research Act has been introduced into Congress by Senators Chuck Grassley (R-IA) and Tina Smith (D-MN). The intent of the legislation would be to direct the USDA Economic Research Service to analyze whether concentration in beef packing impacts farmers, ranchers and ultimately, retail prices to consumers.
Senator Grassley stated, “Consolidation in the meat and poultry industry impacts Iowa producers and consumers alike and right now they’re feeling the squeeze.” He pointed to the fact that four major packers are responsible for 85 percent of beef capacity.
 Currently, there is inordinate unjustified and unsubstantiated finger-pointing, accusing packers of market manipulation and applying pressure on feeders. The title of the proposed Act essentially acknowledges that there is a lack of information concerning the economic impact of consolidation that at face value improves efficiency and should lower costs. The high retail price of beef in 2026 is a function of disequilibrium between supply and demand. The national herd is at a record low due to disruption of the production cycle extending from cow-calf operations through grow-out and feeding. Reasons for the shortage of available slaughter stock include a prolonged drought, high production costs, closure of the border with Mexico following outbreaks of New World screwworm, an erratic tariff policy and an overall failure to project and maintain production levels in relation to future demand. Currently, there is inordinate unjustified and unsubstantiated finger-pointing, accusing packers of market manipulation and applying pressure on feeders. The title of the proposed Act essentially acknowledges that there is a lack of information concerning the economic impact of consolidation that at face value improves efficiency and should lower costs. The high retail price of beef in 2026 is a function of disequilibrium between supply and demand. The national herd is at a record low due to disruption of the production cycle extending from cow-calf operations through grow-out and feeding. Reasons for the shortage of available slaughter stock include a prolonged drought, high production costs, closure of the border with Mexico following outbreaks of New World screwworm, an erratic tariff policy and an overall failure to project and maintain production levels in relation to future demand.
The legislation has been endorsed by the National Farmers Union and Senators Grassley and Smith intend to include their directive in the long-delayed Farm Bill.
It would be best for the USDA-ERS to concentrate on the beef industry in their analysis, since this is where the U.S, problem exists. Probing into the chicken industry would appear to be an unnecessary exercise given the integrated structure of broiler production and the diversity of scope and the number of companies producing chickens for domestic consumption and export.
|
Smithfield Foods Posts FY 2025 Results
|
|
 On March 24th, Smithfield Foods, a subsidiary of the WH Group and a leading pork producer in the U.S., posted results for Q4 and FY 2025 ending December 28th. The company posted net income of $998 million on sales of $15,531 million with a diluted EPS of $2.51. These values compare with FY 2024 with net income of $970 million on sales of $14,142 million and a diluted EPS of $2.51. On March 24th, Smithfield Foods, a subsidiary of the WH Group and a leading pork producer in the U.S., posted results for Q4 and FY 2025 ending December 28th. The company posted net income of $998 million on sales of $15,531 million with a diluted EPS of $2.51. These values compare with FY 2024 with net income of $970 million on sales of $14,142 million and a diluted EPS of $2.51.
Smithfield Foods posted total assets of $12,177 million with good and intangible assets valued at $2,883 million. Long-term debt, lease obligations and other liabilities amounted to $2,505 million.
On March 24th, Smithfield Foods (SFD) had a market capitalization of $9.09 billion. Over the past 52 weeks, share price has ranged from a low of $18.55 to $26.07 with a 50-day moving average of $23.98. The share trades with a forward P/E of 10.2. Trailing 12-month operating margin was 8.1 percent and profit margin 5.7 percent. The company returned 6.9 percent on assets and 14.0 percent on equity. SFD closed at $23.49 on March 23rd and rose to $25.32 by 10H40 following the release of results, closing at $24.47 on March 24th.
|
FDA Implicates RAW FARM Brand in STEC Outbreak
|
|
A dose of his own medicine
|
According to a March 15th Food and Drug Administration (FDA) release, the Agency in collaboration with the Centers for Disease Control and Prevention are investigating an outbreak of E. coli 0157:H7 infection. Traceback has implicated RAW FARM brand shredded cheddar cheese.
Based on the determination, FDA recommended a voluntary removal that was rejected by the manufacturer. To date, seven cases among California, Florida and Texas have been documented with two hospitalizations. Onset of illness ranges from September 1st, 2025, to February 13th, 2026. Whole genome sequencing confirmed the genetic relationship among isolates from patients, although no RAW FARM cheddar cheese products have yielded the implicated E. coli, [but additional sampling and assay is in progress.
It is extremely injudicious of any company to reject a suggested FDA recall. In the event of isolation of the implicated pathogen from company product, RAW FARM, LLC, will be vulnerable to product liability claims for which there will be no valid defense. Unfortunately, E. coli 0157:H7, with four children affected in this outbreak, may have severe health consequences. These include hemolytic uremia syndrome requiring prolonged hospitalization and the prospect of future renal dysfunction.
Raw Farm LLC is located in Fresno, CA with production facilities in Kerman, CA. The operation sells raw milk and derived products including cheeses. The CEO (self-styled Chief Excitement {or Excrement} Officer of the fifth-generation enterprise is Mark McAfee who is a leader in promoting non-pasteurized milk.
 For the record, products from Raw Farms Inc. have been involved in 13 documented outbreaks of milk-borne infections including salmonellosis and STEC E.coli in recent years. These incidents have involved close to 240 diagnosed cases and numerous hospitalizations with many children affected by hemolytic uremia syndrome. For the record, products from Raw Farms Inc. have been involved in 13 documented outbreaks of milk-borne infections including salmonellosis and STEC E.coli in recent years. These incidents have involved close to 240 diagnosed cases and numerous hospitalizations with many children affected by hemolytic uremia syndrome.
It is estimated by USDA* that E. coli 0157 STEC infections cost $504 million in 2023 for approximately 176,000 cases with a mean per-case cost of $2,865. With the hemolytic uremia complication, cost per case may rise into six figures.
*Hoffmann, S., et al Economic Burden of Foodborne Illnesses Acquired in the United States Foodborne Pathogens and Disease 22:4-14 (2025)
|
USDA-AMS Considering Amendments to the National List
|
|
 In accordance with the Organic Foods Production Act of 1990, the USDA Agricultural Marketing Service (AMS) is soliciting public comment on amending the List of Allowed and Prohibited Substances referred to as the “National List”. Of importance to the poultry industry is a proposed removal of restrictions on incorporation of methionine in organic poultry feed. In accordance with the Organic Foods Production Act of 1990, the USDA Agricultural Marketing Service (AMS) is soliciting public comment on amending the List of Allowed and Prohibited Substances referred to as the “National List”. Of importance to the poultry industry is a proposed removal of restrictions on incorporation of methionine in organic poultry feed.

Methionine is synthesized in a fermentation process using selected microorganisms that may or may not have been subject to genetic modification. Notwithstanding the fact that production of synthetic amino acids is essentially an industrial-scale process, the final products including methionine, lysine, tryptophan and threonine, all essential amino acids and are structurally identical and are metabolized in the same way as the natural equivalents in vegetable ingredients whether conventional or organic. In the absence of commercially available methionine and other essential amino acids, it is difficult and expensive to formulate feeds that are nutritionally adequate and contribute to optimal growth and sustainability.

As with many decisions made by statutory committees functioning under the Organic Foods Production Act, unnecessary and scientifically baseless restrictions and regulations are applied. Decisions rely on sentiment, misunderstanding and in the worst instance, mendacity with vested interests disfavoring commercial livestock production.
|
Tyson Foods to Defend Class Action Lawsuit Over Wages
|
|
 U.S. District Judge Thomas O. Rice has advanced a class action lawsuit by workers at the Wallula, WA. plant. The Court denied, in part, the motion by Tyson to dismiss the suit relating to wage payments from 2016 through early 2023. At issue is the alleged failure by Tyson to provide compliant meal breaks, minimum wage, overtime and termination payments. The Court dismissed U.S. District Judge Thomas O. Rice has advanced a class action lawsuit by workers at the Wallula, WA. plant. The Court denied, in part, the motion by Tyson to dismiss the suit relating to wage payments from 2016 through early 2023. At issue is the alleged failure by Tyson to provide compliant meal breaks, minimum wage, overtime and termination payments. The Court dismissed  claims relating to rest-breaks on the basis of insufficient, specific, factual evidence. The Court also dismissed with prejudice claims relating to reimbursement of workers for gloves and boots. The class was allowed twenty days to file a second amended complaint relating to the aspects of the claims that were denied. The significance of this case relates to the eventual rulings that will become case law and will influence similar claims in subsequent cases in different jurisdictions. claims relating to rest-breaks on the basis of insufficient, specific, factual evidence. The Court also dismissed with prejudice claims relating to reimbursement of workers for gloves and boots. The class was allowed twenty days to file a second amended complaint relating to the aspects of the claims that were denied. The significance of this case relates to the eventual rulings that will become case law and will influence similar claims in subsequent cases in different jurisdictions.
In a separate issue, an ex-employee of the Tyson Foods, Ringgold, VA. plant filed a March 16th complaint in the U.S. District Court for the Western District of Virginia. The Plaintiff, Alvin Clark, alleges race and age discrimination, retaliation and a hostile work environment. Clark worked as a maintenance mechanic at the plant from mid-July 2024 until March 2025. He alleges he was denied promotion based on race and age despite suitable qualifications. The lawsuit was filed in accordance with Title VII of the Civil Rights Act, Section 1981 of the Age Discrimination Employment Act and the Virginia Human Rights Act and the Virginia Workplace Retaliation and Safety Laws.
In a statement, the Company emphasized a zero-tolerance policy for racism, harassment or retaliation in the workplace and is committed to a respectful environment for team members. Tyson Foods “Categorically denies the allegations and will address them through the appropriate legal process”.
|
NFU Supports House Version of the Delayed Farm Bill
|
|
In a recent statement, the National Farmers Union praised the House Committee on Agriculture in marking-up The Farm, Food and National Security Act of 2026.

NFU president Rob Larew noted, “We recognize the hard work that went into this mark-up. Bipartisan progress in today’s Congress is not insignificant, and we are grateful to the members who engaged seriously with the challenges facing family agriculture.” Notwithstanding the achievement, enactment of a Farm Bill will require considerable work in both chambers of Congress with the inevitable pressure exerted by lobbyists representing agricultural organizations.
The proposed Farm bill has been delayed for over a year by bipartisan differences, especially with respect to food benefits and the required magnitude of support for farmers who have been impacted by an erratic tariff policy reflecting a lack of a comprehensive and progressive economic program.

Corporate consolidation in the red meat sector will also be contentious as conflicting opinions on the reasons for escalation in the price of red meat swirl around both House and Senate.
Larew concluded the NFU statement by urging a concerted effort to resolve differences, stating, “The challenges facing family farmers and ranchers are urgent, and the final Farm Bill must reflect that reality.”
|
Brands Withdrawing from “Better Chicken Commitment”
|
|
Activist Watch Weekly, prepared by Will Coggin of the Berman Group has reported that major UK brands including KFC, Nando’s and Popeye’s have withdrawn from the “Better Chicken Commitment”.
The obligations implicit in the various levels of the “Better Chicken Commitment” are antithetical to sustainability and have increased the cost of product. There is a growing realization that consumers are opting for lower cost of raw and prepared chicken and now place less emphasis on welfare in the purchase decision.
Over the past decade, welfare organizations including Humane World, Mercy for Animals, the SPCA and the Humane League have individually or collectively coerced retailers, distributors of branded eggs, chicken, turkey and derived products to accept onerous and scientifically indefensible welfare standards. These organizations are less interested in flock welfare than they are in ultimately destroying all intensive livestock production in pursuit of a vegan agenda.

Although a number of producers have modified housing and production practices to conform to the lowest tier of the “Better Chicken Commitment”, the realities of successive escalation in standards are now apparent and the marketing benefit from certification is now in question.
The Center for the Environment and Welfare, supported by the food industry has created a new website www.environmentandwelfare.com that posts reports on the environmental impact and activities of welfare organizations and pending legislation.
|
|
Shane Commentary
|
|
|
|
|